Thirty-eight TD (22 males, 16 females) and 28 ASD (20 males, 8 females) were included; 138 study visits were completed: 50 placebo (P) (26 TD, 24 ASD), 50 low-dose (L) (30 TD, 20 ASD), 38 high-dose (H) (19 TD, 19 ASD). Please see Table 1 for demographics. The null hypothesis held for all of the Shapiro-Wilk normality tests of the ERP and ERSP responses of the TD and ASD groups under different experimental conditions.
MMN was comparable in ASD and TD; arbaclofen had a minimal impact on the MMN in the TD group only
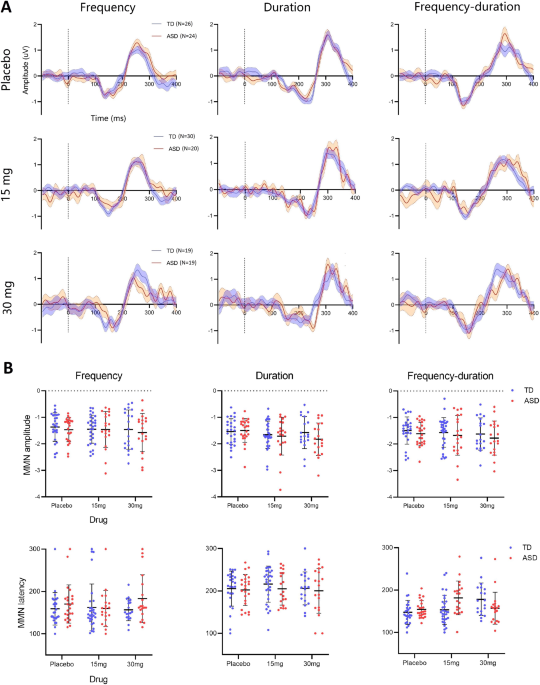
As shown in Fig. 1A, the MMN appeared as a negative valley in the grand average waveforms [100, 250] ms post stimulus onset and persisted across stimulus conditions and drug administrations in both groups. Individual-level ERP features (MMN amplitudes and corresponding latencies) are shown in Fig. 1B. There were neither significant group differences nor any group-drug interactions in the MMN amplitudes or latencies in any of the three deviant stimulus conditions (see Supplementary Information).

A The MMN grand average waveforms of the TD group (blue) and ASD group (red) as functions of the stimulus conditions (column) and drug administrations (row). Data epoch was drawn in the interval [−100, 400] ms referenced to the stimulus onset at 0 ms. Dashed lines indicate the stimulus onsets. B Individual scatter plots of MMN amplitudes (uV) and latencies (ms). N number of participants. Error bar shows the standard deviants (SD).
A The MMN grand average waveforms of the TD group (blue) and ASD group (red) as functions of the stimulus conditions (column) and drug administrations (row). Data epoch was drawn in the interval [−100, 400] ms referenced to the stimulus onset at 0 ms. Dashed lines indicate the stimulus onsets. B Individual scatter plots of MMN amplitudes (uV) and latencies (ms). N number of participants. Error bar shows the standard deviants (SD).
Repetition suppression in ERP responses occurred in both TD and ASD; but suppression of P1 was significantly less in ASD
Standalone grand average ERP waveforms of responses to the standard tones and the three deviants (frequency, duration, and frequency-duration) without subtraction are shown in Fig. 2A. Three prominent ERP components were observed in both the TD group and the ASD group: (i) an early P1 component appeared as a positive peak within the range [50, 100] ms post stimulus onset; (ii) a negative N1 components located within [100, 200] ms; (iii) a late P2 component followed N1 as a positive peak. The P2 component mostly contributed to the P3a after the MMN (Fig. 1A) and was therefore not further examined. For the duration deviant, there were two negative valleys located within [100, 300] ms. The latter was used as it aligned with the temporal range of the duration MMN (Fig. 1A).

A The grand average waveform for the TD (blue) and ASD (red) group of ERP responses to standard tones and the three deviants (frequency, duration, and combined) without subtraction at the three-drug administrations (row). Dashed lines indicate the stimulus onsets. Components where a significant group difference was observed were marked with asterisks. B Individual scatter plots of the P1 and N1 amplitudes (µV) for the TD (blue) and ASD (red) group as a function of the stimulus condition at placebo/drug administration. The comparisons between stimulus conditions were achieved by paired-samples t test and corrected using the Benjamini–Hochberg method. *, the difference is statistically significant with corrected p < 0.05; **, the difference is statistically significant with corrected p < 0.01; ***, the difference is statistically significant with corrected p < 0.001. Error bars show SD.
A The grand average waveform for the TD (blue) and ASD (red) group of ERP responses to standard tones and the three deviants (frequency, duration, and combined) without subtraction at the three-drug administrations (row). Dashed lines indicate the stimulus onsets. Components where a significant group difference was observed were marked with asterisks. B Individual scatter plots of the P1 and N1 amplitudes (µV) for the TD (blue) and ASD (red) group as a function of the stimulus condition at placebo/drug administration. The comparisons between stimulus conditions were achieved by paired-samples t test and corrected using the Benjamini–Hochberg method. *, the difference is statistically significant with corrected p < 0.05; **, the difference is statistically significant with corrected p < 0.01; ***, the difference is statistically significant with corrected p < 0.001. Error bars show SD.
At placebo, the ASD group had significantly higher P1 amplitudes than TD in response to standard tones (t(48) = 2.8, p = 0.01), duration deviants (t(48) = 2.3, p = 0.03) and combined deviants (t(48) = 3.3, p = 0.004); the mean of ASD in response to frequency deviants was also higher than TD, though this difference was not significant (t(48) = 1.3, p = 0.2). Individual scatter plots of P1 amplitudes are shown in Fig. 2B (top). At placebo, P1 amplitudes to repeated standard tones were significantly attenuated (suppressed) relative to those to frequency deviants in TD (t(25) = 2.8, p = 0.03), but not in ASD. At 30 mg arbaclofen, P1 amplitudes to standards in ASD were significantly suppressed compared with those to the three deviants (frequency: t(18) = 2.6, p = 0.04; duration: t(18) = 2.7, p = 0.04; frequency-duration: t(18) = 2.5, p = 0.04), while there was no difference between responses to standards and any deviants in TD. There was no difference in response between any pair of the three deviants. No drug effect or group-drug interaction was observed for TD or ASD under any condition. Statistics reported were corrected using the Benjamini–Hochberg method.
Individual scatter plots of the amplitudes of the N1 component are shown in Fig. 2B (bottom). At placebo and drug administrations, N1 amplitudes to standard tones were significantly suppressed relative to any of the three deviants in both the TD and ASD groups. Statistical results of N1 comparisons between each pair of stimulus conditions are shown in Table S1 in Supplementary Information. There was no difference in response between any pair of the three deviants. No group difference, drug effect or group-drug interaction was observed at any stimulus condition.
Repetition suppression of spectral responses was weaker in ASD; arbaclofen shifted spectral responses to a more typical profile in ASD but disrupted spectral response in TD
Qualitative observations
The ERSPs under different stimulus and drug conditions are presented in Fig. 3A, B. At placebo, repeated standard tones induced perturbations in the theta and alpha band [4, 12] Hz in ASD but spectral responses to repeated standards were clearly suppressed in TD. Low-dose (15 mg) and high-dose (30 mg) arbaclofen caused suppression of the standard-induced changes in ASD but reduced suppression in TD. The three deviants induced prominent spectral perturbations in both TD and ASD regardless of drug administration.

The grand average ERSP responses under different stimulus and drug conditions are presented for the TD group (A) and the ASD group (B). The x axis shows the time, and the y axis indicates spectral permutations within the [4, 20] Hz band. Dashed lines indicate the stimulus onsets. C Scatter plots of ERSP responses in [4, 12] Hz are presented for the TD (blue) and ASD (red) group at placebo (top left), 15 mg (top right), and 30 mg (bottom left). The x axis indicates the stimulus conditions. ERSP responses to repeated standards are separately displayed (bottom right) to show the group-drug interaction measured by LMM. The comparisons between stimulus conditions were achieved by paired-sample t test and corrected using the Benjamini–Hochberg method. *, the difference is statistically significant with corrected p < 0.05; **, the difference is statistically significant with corrected p < 0.01. Error bars show SD.
The grand average ERSP responses under different stimulus and drug conditions are presented for the TD group (A) and the ASD group (B). The x axis shows the time, and the y axis indicates spectral permutations within the [4, 20] Hz band. Dashed lines indicate the stimulus onsets. C Scatter plots of ERSP responses in [4, 12] Hz are presented for the TD (blue) and ASD (red) group at placebo (top left), 15 mg (top right), and 30 mg (bottom left). The x axis indicates the stimulus conditions. ERSP responses to repeated standards are separately displayed (bottom right) to show the group-drug interaction measured by LMM. The comparisons between stimulus conditions were achieved by paired-sample t test and corrected using the Benjamini–Hochberg method. *, the difference is statistically significant with corrected p < 0.05; **, the difference is statistically significant with corrected p < 0.01. Error bars show SD.
Scatter plots of the ERSP responses in the [4, 12] Hz band are shown in Fig. 3C. At placebo, spectral responses to repeated standard tones in TD were significantly suppressed compared with those to the frequency deviants (t(25) = 2.2, p = 0.03) and the duration deviants (t(25) = 3.7, p = 0.005), while no suppression was observed in ASD. At 15 mg, the suppression between standards and the duration deviants remained significant in TD (t(29) = 3.7, p = 0.03). At 30 mg, spectral responses to repeated standard tones in ASD were significantly suppressed compared with those to the frequency deviants (t(18) = 2.6, p = 0.03) and the duration deviants (t(18) = 2.7, p = 0.03), while the typical suppression was disrupted in TD. There was no difference between any pair of the three deviants. The LMM confirmed a significant group-drug interaction (eff(134) = −2.1, p = 0.03) in responses to standard tones. This was explained by a significant drug effect in spectral response to standards in ASD (eff(61) = −2.3, p = 0.02) but not in TD (eff(73) = 0.4, p = 0.7). No group difference, drug effect, or interaction was observed in responses to any of the three deviants. Statistics reported were corrected using the Benjamini–Hochberg method.
Comparisons between pre- and post-deviant standards:
Repetition suppression to pre-deviant standards was significantly weaker in ASD and was rescued by arbaclofen.
Repetition suppression to pre-deviant standards was stronger in TD and disrupted by arbaclofen.
In a repeated sequence, responses to later stimuli are expected to be more suppressed than responses to early stimuli, such as those at the beginning or after a deviant [2]. The ‘pre-deviant standard’ was defined as the last sound in a four-in-a-row standard sequence before a deviant. The ‘post-deviant standard’ was the first after a deviant (Fig. 4A).

A Timeline schematic of an example stimulus delivery that the pre-deviant standard (yellow) and post-deviant standard (green) are adjacent to the deviant (black). B The grand average waveforms of ERP responses to pre-deviant and post-deviant standards at different drug administrations for TD (blue) and ASD (red). Dashed lines indicate the stimulus onsets. C Scatter plots of the P1 (top) and N1 (bottom) amplitudes. The group differences were generated using an independent-samples t test and corrected using the Benjamini–Hochberg method. D The grand average ERSP responses to pre-deviant and post-deviant standards. E Scatter plots of ERSP responses in [4, 12] Hz band. The LMM group-drug interaction in ERSP responses to pre-deviant standards is displayed with broken mean lines.
A Timeline schematic of an example stimulus delivery that the pre-deviant standard (yellow) and post-deviant standard (green) are adjacent to the deviant (black). B The grand average waveforms of ERP responses to pre-deviant and post-deviant standards at different drug administrations for TD (blue) and ASD (red). Dashed lines indicate the stimulus onsets. C Scatter plots of the P1 (top) and N1 (bottom) amplitudes. The group differences were generated using an independent-samples t test and corrected using the Benjamini–Hochberg method. D The grand average ERSP responses to pre-deviant and post-deviant standards. E Scatter plots of ERSP responses in [4, 12] Hz band. The LMM group-drug interaction in ERSP responses to pre-deviant standards is displayed with broken mean lines.
The grand average ERSP responses to pre- and post-deviant standards are shown in Fig. 4D. The group difference in standard responses previously observed in the placebo condition (Fig. 3) appeared driven by differences in pre-deviant but not post-deviant responses. At individual-level (Fig. 4E), significant group differences were observed following placebo and drug administrations in responses to pre-deviant standards (at placebo, t(48) = 2.1, p = 0.04; at 15 mg, t(48) = −2.3, p = 0.04; at 30 mg, t(48) = −2.1, p = 0.04) but not to post-deviant standards. LMM results confirmed a strong group-drug interaction in responses to pre-deviant standards (eff(133) = −3.3, p = 0.002), but not in responses to post-deviant standards. Specifically, spectral responses to pre-deviant standards increased with drug dose in TD (eff(73) = 2.4, p = 0.01; weaker suppression with increasing dose) while they decreased in ASD (eff(60) = −2.3, p = 0.02; stronger suppression with increasing dose). Statistics reported were corrected using the Benjamini–Hochberg method.
Although the age range of the ASD and TD groups was similar (20–51 years and 19–53 years respectively, see Table 1), the mean age of the ASD group (34.8 years) was higher than that of the TD group (28.6 years) (t(66) = 2.7, p = 0.01). However, the LMM results with age controlled as a fixed variable confirmed there was no age effect observed in our main outcomes, such as the amplitude of the P1 component (eff(132) = 0.3, p = 0.7) and the ERSP responses (eff(132) = 0.18, p = 0.8) to pre-deviant standard tones. Thus, age difference was unlikely to explain any group differences reported.
Individual sensitivity to GABAB activation and relationship with wider autistic symptomatology
We defined a GABAB ‘sensitivity index’ for each individual as the difference in spectral responses to pre-deviant standards at placebo minus those at 30 mg arbaclofen.
The placebo-30 mg transitions in the two groups are shown in Fig. 5A. Eleven out of 12 (92%) TD participants showed an increased effect of drug—a significant within-group placebo-30 mg difference (t(11) = 5.1, p = 3.4 × 10⁻⁴). In contrast, 11 out of 17 ASD (65%) showed a decreased effect of drug, generating a significant within-group placebo-30 mg difference (t(16) = −2.8, p = 0.01). The group difference in the sensitivity index was also significant (t(27) = 4.4, p = 1.3 × 10⁻⁴; Fig. 5B). There was a significant partial correlation between GABAB response sensitivity and total scores on the AQ across the TD and ASD groups after controlling for group (r(26) = −0.41, p = 0.03; Fig. 5C); and between response to AQ question 5: “I often notice small sounds when others do not” (r(26) = −0.45, p = 0.02; Fig. 5D). However, as treating both groups as one sample can confound interpretation, we also examined within-group correlation with AQ. The correlation did not reach statistical significance in either ASD or TD, potentially due to the loss of power (TD: r(12) = −0.41, p = 0.18; ASD: r(14) = −0.45, p = 0.11).

A The transition graphs show the shift effect between placebo and 30 mg arbaclofen on TD and ASD. Yellow lines indicate a decrease in evoked power following arbaclofen (the majority of the ASD group); gray lines indicate an increase in evoked power following arbaclofen (the majority of the TD group). Only one individual in the TD group (yellow) had a decrease in evoked power in response to arbaclofen (behaving more like the ASD group); that person also had the highest AQ score in the TD group. B The scatter plots of extracted sensitivity indexes. C The partial correlation between the sensitivity index and total AQ scores is significant after controlling for group. The point at which the direction of the sensitivity index changed (i.e., crosses the x axis) approximates the AQ ‘cut-off’ for ASD [60]. D The partial correlation between the sensitivity index and sound sensitivity captured by AQ question 5 score is significant after controlling for group. However, the within-group correlation did not reach significance in the TD (E) or ASD group (F) when examined separately.
A The transition graphs show the shift effect between placebo and 30 mg arbaclofen on TD and ASD. Yellow lines indicate a decrease in evoked power following arbaclofen (the majority of the ASD group); gray lines indicate an increase in evoked power following arbaclofen (the majority of the TD group). Only one individual in the TD group (yellow) had a decrease in evoked power in response to arbaclofen (behaving more like the ASD group); that person also had the highest AQ score in the TD group. B The scatter plots of extracted sensitivity indexes. C The partial correlation between the sensitivity index and total AQ scores is significant after controlling for group. The point at which the direction of the sensitivity index changed (i.e., crosses the x axis) approximates the AQ ‘cut-off’ for ASD [60]. D The partial correlation between the sensitivity index and sound sensitivity captured by AQ question 5 score is significant after controlling for group. However, the within-group correlation did not reach significance in the TD (E) or ASD group (F) when examined separately.
To explore post hoc whether our data informed a possible stratification approach [22], we defined a stratification ‘threshold’ as the mean of baseline ERSP responses to pre-deviant standards in ASD. We first confirmed almost all TD participants who completed both placebo and high-dose visits were below this threshold (11 out of 12; 92%). Next, we used the stratification threshold to evenly divide the ASD group (17 in total) into two subgroups with 8 above (‘hyper’ group) and 9 below (‘hypo’ group) the threshold. Arbaclofen shifted the baseline ERSP responses down in all individuals from the ‘hyper’ group; however, it showed a heterogeneous effect in the ‘hypo’ group: baseline responses were shifted up in two-thirds of autistic participants and down in the remainder. A significant group-drug interaction was confirmed by LMM (eff = 2.4, p = 0.02).
This content was originally published here.