For the following analyses, several genes were selected from previous ASD studies (Table 2, Supplementary Table 1). All analyses for each ASD associated gene use the previous summary statistics of the ASD GWAS meta-analysis as an input.
Twelve genes were selected through proximity to the 5 SNPs reaching genome-wide significance in the ASD GWAS from Grove and colleagues [7] (i.e., within 50 kb of the region spanned by all SNPs with r2 ≥ 0.6 to the index variant), who also performed a gene-based analysis (GBA) using MAGMA, allowing the identification of 15 associated genes. The majority of these genes were located near the genome-wide significant SNPs identified in the GWAS, but 7 genes are located in four additional genomic regions and a cluster of genes is harbored on chromosome 17 (KANSL1, WNT3, MAPT and CRHR1).
Another GBA further mining the same GWAS data but leveraging a novel GBA tool (PASCAL (Pathway scoring algorithm)) [13], highlighted additional genes which are here considered (CRHR1-IT1 and LOC644172), although most of them were previously reported by MAGMA.
Lastly, Rodriguez-Fontenla et al. also integrated tissue-expression and genetic data from Grove ASD GWAS by performing transcriptome-wide association studies (TWAS) [14], demonstrating the association of 4 genes at the brain level (CIPC, PINX1, NKX2-2 and PTPRE) and highlighting the association of NKX2-2, MANBA, ERI1 and MITF at the gastrointestinal level. Due to lack of eQTL data to raise statistical power in the genes associated at the gastrointestinal level, they will not be taken into account in this study.
eQTpLot: visualization of colocalization between EQTL and GWAS data
We ran eQTpLot using as input ASD GWAS summary statistics data from the Psychiatric Genomics Consortium (PGC) and 5 available studies aforementioned (p-values for the SNPs from GWAS analysis) and GTEx (expression data including p-values for the SNP from eQTL analysis) (see section above).
We defined a variant as an expression quantitative trait locus (eQTL) for the candidate gene if its gene expression p-value was ≤0.05 (significance threshold for eQTL, default option in eQTpLot); variants with p-value > 0.05 were excluded from the analysis. In order to identify the list of all significant variant-gene pairs in the GTex eQTL dataset, a genome-wide empirical p-value threshold, pt, was defined as the empirical p-value of the gene closest to the 0.05 FDR threshold. pt was then used to calculate a nominal p-value threshold for each gene [17, 18]. Variants with a nominal p-value below the gene-level threshold were considered significant and included in the final list of variant-gene pairs.
The significance threshold for GWAS data was set to 5 × 10−08 for colocalization analysis (corresponds to the horizontal line in plots and GWAS significance thresholds for the eQTL enrichment plot, default option in eQTpLot) .
EQTL-GWAS colocalization plots
Multi and PAN Tissue analysis
In order to visualize the variants’ effect on candidate gene expression across all tissues, we performed Pan Tissue analysis by setting the argument tissue to ‘all’. In order to visualize its effect across multiple tissues contained in a specified list of tissues, we performed the Multi Tissue analysis focusing on brain tissue (“Brain_Amygdala”, “Brain_Anterior_cingulate_cortex_BA24”, “Brain_Caudate_basal_ganglia”, “Brain_Cerebellar_Hemisphere”, “Brain_Cerebellum”, “Brain_Cortex”, “Brain_Frontal_Cortex_BA9”, “Brain_Hippocampus”, “Brain_Hypothalamus”, “Brain_Nucleus_accumbens_basal_ganglia”, “Brain_Putamen_basal_ganglia”, “Brain_Spinal_cord_cervical_c-1” and “Brain_Substantia_nigra”).
The analyzed phenotype was ASD in all instances and the assembly of the human genome was hg19.
eQTL-GWAS colocalization plots were created defining a locus of interest (LOI) for each of the selected genes to include the target gene’s coordinates along with ± 1000 kb of flanking genome (specified with the argument range) (Supplementary Table 1, Supplementary Fig. 1), so that GWAS data (summary statistics) are filtered out to include only those variants which fall within the LOI. The mapping window was defined as 1 Mb on either side of the gene of interest, based on the consideration that only cis-eQTL (associated with expression of a gene within a 1 Mb distance [19]) were included in our analysis. The significance threshold was set to 5 × 10−08 for colocalization analysis (red line in colocalization plots).
Congruous and incongruous variants
An additional parameter, ‘congruence’, was set to TRUE in order to divide variants into two groups: congruous (variants with the same direction of effect on gene expression and the GWAS trait; e.g., a variant that is significantly associated with a target’s gene increased expression also results in an increase in the GWAS trait) and incongruous (variants with opposite effects on gene expression and the GWAS trait, e.g. a variant that is significantly associated with a target’s gene increased expression but results in a decrease in the GWAS trait).
EQTL enrichment plots
eQTL enrichment plots were generated for the selected LOI to test if there is a significant enrichment (p-value by Fisher’s exact test) for eQTLs among GWAS-significant variants, so that each variant in the chromosomal space defined inside the LOI is represented along the horizontal axis, with the inverse log of the p-value of association with the specified GWAS trait on the vertical axis.
P–P correlation plots
So as to analyze the correlation between GWAS and eQTL’s p-value, we plotted a best fit linear regression over the points, so that each of the variants within the LOI is plotted with −log10 (p-value eQTL) along the horizontal axis and −log10 (p-value GWAS) along the vertical axis. The Pearson correlation coefficient (r) and p-value of correlation (p) are also computed and displayed in the plot, differentiating between variants with congruous and incongruous direction of effects. Significant correlations are defined as having a r ≥ 0.7 and p-value of correlation ≤0.05.
Gene expression, gene network and related human disease-associated genes analysis
Gene expression heatmap
Gene network analysis
HumanBase (https://hb.flatironinstitute.org/) was used to build a gene network for novel findings selected by the eQTL colocalization analysis (Table 3) and specific to brain tissue, capturing tissue-specific gene function (Tissue-Specific Gene Networks: GIANT). MAPT, NKX2-2, and PTPRE were selected as the input genes along with brain tissue in the 5 existing data types (co-expression, TF binding, interaction, GSEA microRNA targets, GSEA perturbations). The resultant network contains the subset of functionally related genes (Supplementary Table 4, n = 50), all of which were used to test for functional enrichment using genes annotated to Gene Ontology biological process terms. Within each cluster, representative processes and pathways that showed enrichment were identified and presented along with their corresponding Q values. The Q value of each term is calculated using one-sided Fisher’s exact tests and Benjamini–Hochberg corrections to correct for multiple tests (Table 4). We also carried out an enrichment analysis in DIsGeNET (https:// metascape.org), containing a large collections of genes and variants associated to human diseases (429,036 gene-disease associations (GDAs), linking 17,381 genes to 15,093 diseases and 72,870 variant-disease associations (VDAs), between 46,589 SNPs and 6356 diseases and phenotypes) [21].
For each gene with a significant association between GWAS and eQTL’s p-value (r > 0.7, p-value < 0.05), we further addressed colocalization in an additional set of GWAS studies for SZP, ADHD and MD because of previously reported highly significant genetic correlation [7, 22], so that we get more clues on the possible mechanisms underlying the colocalization signals.
From the total of 27 LOI analyzed here (Supplementary Table 2, Supplementary Figs. 2–44), we found 8 previously associated via GWAS/TWAS/GBA in which eQTL and GWAS signals colocalize (r > 0.7, p-value < 0.05): CRHR1, KANSL1, MANBA, MAPT, MMP12, NKX2-2, PTPRE and WNT3 (Table 3, Supplementary Figs. 2–44). Although not reaching the positive correlation coeficient threshold of r > 0.7, SRPK2 yields a marginal positive correlation with great statistical support (r = 0.69, p < 1 × 10⁻⁶). Moreover, we addressed whether the SNPs-eQTLs within these LOI colocalize in a different set of tissues, and found that MAPT (r = 0.76 congruent variants), NKX2-2 (r = 0.71 congruent variants), and PTPRE (r = 0.70 congruent variants and r = 0.97 incongruent variants) exhibit the strongest correlation when restricting the eQTL analysis to brain tissue.
When addressed in the follow-up analysis, all genes besides NKX2-2 were confirmed to have a significant association between GWAS and eQTL’s p-value in correlated neuropsychiatric disorders, with CRHR1, KANSL1, MAPT, PTPRE and WNT3 yielding a significant correlation when restricted to brain tissue (Supplementary Table 3).
CRHR1 (Corticotropin Releasing Hormone Receptor 1)
The available eQTL data is currently insufficient to draw definitive conclusions regarding the role of CRHR1 in brain tissue. However, in the Pan Tissue analysis for ASD, this gene has exhibited significant colocalization of congruent/incongruent variants (r = 0.96, p-value < 1 × 10⁻⁶) (Supplementary Fig. 5). Similar trends were observed in both schizophrenia datasets (congruent r = 0.97, p-value < 1 × 10⁻⁶; incongruent r = 0.73, p-value < 1 × 10⁻⁶).
KANSL1 (KAT8 Regulatory NSL Complex Subunit 1)
KANSL1 has shown positive correlation in the Pan Tissue analysis for ASD and congruent/incongruent variants (congruent r = 0.82, p-value < 1 × 10⁻⁶; incongruent r = 0.85, p-value < 1 × 10⁻⁶) (Supplementary Fig. 7). A significant correlation signal was observed specifically in brain tissue when assessed in SZP (incongruent r = 0.73, p-value = 3.04−02).
MANBA (Mannosidase Beta A)
In the ASD Pan Tissue analysis, incongruent variants for MANBA proof significantly correlated (r = 0.70, p-value < 1 × 10⁻⁶) (Supplementary Figure 12), being this findings replicated in MD (congruent r = 0.81, p-value < 1 × 10⁻⁶; incongruent r = 0.84, p-value < 1 × 10⁻⁶).
MMP12 (Matrix Metallopeptidase 12)
MMP12 has exhibited a positive correlation with congruent variants in ASD in the Pan Tissue analysis (r = 0.72, p-value = 2.14−04) (Supplementary Fig. 16), and the same direction of effects was observed in ADHD (r = 0.75, p-value = 8.94−05).
SRPK2 (SRSF Protein Kinase 2)
SRPK2 barely meets the specified threshold set for the coefficient of correlation, but it has strong statistical support in the Pan Tissue analysis (r congruent = 0.69, p-value < 1 × 10⁻⁶) (Supplementary Figure 24). There is insufficient data to determine the correlation in brain tissue. However, when analyzed in correlated disorders, a similar effect was observed in ADHD (r congruent = 0.67, p-value < 1 × 10⁻⁶).
WNT3 (Wnt Family Member 3)
For WNT3 the correlation signal in ASD comes from congruent/incongruent variants in the entire set of tissues (congruent r = 0.93, p-value < 1 × 10⁻⁶; incongruent r = 0.945, p-value < 1 × 10⁻⁶) (Supplementary Fig. 25). However, when colocalization was analyzed in other neuropsychiatric disorders, all of them resulted in a significant signal, with the strongest correlation observed in brain tissue for incongruous variants in one schizophrenia dataset (r = 0.91, p-value < 1 × 10⁻⁶).
Significant correlations in the multi tissue analysis
Additionally, NKX2-2 (NK2 Homeobox 2), PTPRE (Protein Tyrosine Phosphatase Receptor Type E) and MAPT (Microtubule-Associated Protein Tau) demonstrate a positive correlation with eQTL signals in brain tissue.
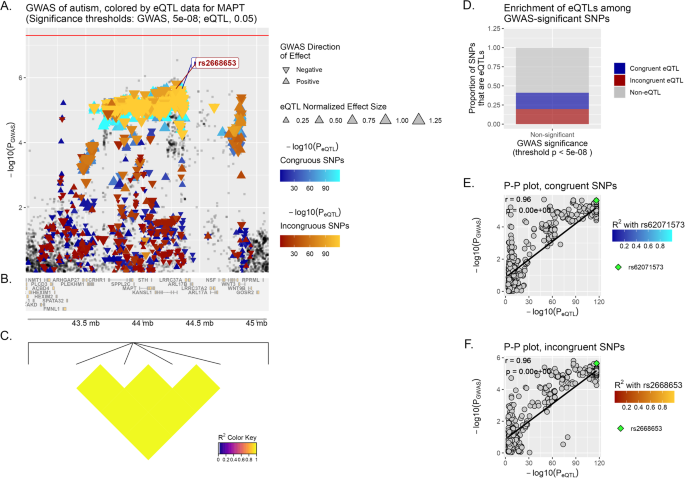
MAPT displays a significant correlation in the Multi Tissue analysis (brain) for incongruent variants (r = 0.76, p < 1 × 10⁻⁶) (Fig. 1), and follows the same trend in MD (r = 0.7, p < 1 × 10⁻⁶).

A Locus of interest, containing MAPT, with chromosomal space indicated along the horizontal axis. Within this plot, variants that lack eQTL data for the specified gene or do not meet the significance threshold are plotted as gray squares. On the opposite, variants that are determined to act as eQTLs for MAPT are plotted as colored triangles, with a color gradient corresponding to the inverse magnitude of its effect on gene expression or p-value. Congruous effects are plotted using a blue color scale, in contrast to variants having an incongruous effect, in red. The size of each triangle is proportional to the eQTL normalized effect size (NES), while the directionality of each triangle corresponds to the direction of effect of the variant on the GWAS trait. Horizontal red line marks the significance threshold in GWAS (p-value = 5 × 10−08). Finally, we show at the bottom of the plot a depiction of all genes’ genomic positions that fall inside the LOI (B) and a heatmap of LD information of all MAPT eQTL variants (C). D Enrichment of MAPT eQTLs among GWAS-significant/non-significant variants, while E, F depict the correlation between PGWAS and PeQTL for MAPT and ASD, with the computed Pearson correlation coefficient (r) and p-value (p) displayed on the plot. The lead variants, rs62071573 and rs2668653, are identified in each graph (by default the upper-right-most variant on the P–P plot), with all other variants plotted using a color scale corresponding to their squared coefficient of linkage correlation with this lead variant (if available). For reference, the same lead variants are also labeled in (A).
A Locus of interest, containing MAPT, with chromosomal space indicated along the horizontal axis. Within this plot, variants that lack eQTL data for the specified gene or do not meet the significance threshold are plotted as gray squares. On the opposite, variants that are determined to act as eQTLs for MAPT are plotted as colored triangles, with a color gradient corresponding to the inverse magnitude of its effect on gene expression or p-value. Congruous effects are plotted using a blue color scale, in contrast to variants having an incongruous effect, in red. The size of each triangle is proportional to the eQTL normalized effect size (NES), while the directionality of each triangle corresponds to the direction of effect of the variant on the GWAS trait. Horizontal red line marks the significance threshold in GWAS (p-value = 5 × 10−08). Finally, we show at the bottom of the plot a depiction of all genes’ genomic positions that fall inside the LOI (B) and a heatmap of LD information of all MAPT eQTL variants (C). D Enrichment of MAPT eQTLs among GWAS-significant/non-significant variants, while E, F depict the correlation between PGWAS and PeQTL for MAPT and ASD, with the computed Pearson correlation coefficient (r) and p-value (p) displayed on the plot. The lead variants, rs62071573 and rs2668653, are identified in each graph (by default the upper-right-most variant on the P–P plot), with all other variants plotted using a color scale corresponding to their squared coefficient of linkage correlation with this lead variant (if available). For reference, the same lead variants are also labeled in (A).
PTPRE has yielded the strongest correlation in brain tissue overall (incongruent r = 0.97, p-value = 2.63−04) (Fig. 2). When examining this gene in the other set of neuropsychiatric diseases, significant correlations are observed in both ADHD and MD (incongruent r = 0.78, p-value = 8.46−03; incongruent r = 0.94, p-value = 6.15−04, respectively).

See Fig. 1 for additional information about the figure legend.
See Fig. 1 for additional information about the figure legend.
NKX2-2 also demonstrates the highest correlation in brain tissue (incongruent r = 0.71, p-value = 2.26−03), but is the only gene that was not replicated in any other neurodevelopmental disorder included in the analysis (plot not shown).
Gene expression, gene networks and related human disease-associated genes
Expression analysis using BrainSpan RNA-seq data for the set of genes selected by eQTL analysis has shown overexpression of MAPT across every single developmental stage in comparison with the remaining studied genes (Fig. 3a, b). MAPT, NKX2-2 and PTPRE and their interactors in brain tissue (Fig. 3c, Supplementary Table 4) show functional enrichment in processes associated with neurogenesis, neuron differentiation and nervous system functioning and development (Table 4). Moreover, these genes highlight different human diseases, primarily involved in movement and mental disorders (Fig. 3d).

a Gene expression heatmaps for CRHR1, KANSL1, MANBA MAPT, MMP12, NKX2-2, PTPRE and WNT3 using BrainSpan 11 general developmental stages of brain samples and b BrainSpan 29 differentes ages of brain data. Genes are ordered by expression clusters and brain samples and ages by alphabetical order. MMP12 is not shown due to low expression levels in GTEx v8; c HumanBase gene network for MAPT, NKX2-2 and PTPRE and functionally interactors in brain tissue (GIANT software); d Bar graph of enriched associated human diseases across input gene list, colored by p-values.
a Gene expression heatmaps for CRHR1, KANSL1, MANBA MAPT, MMP12, NKX2-2, PTPRE and WNT3 using BrainSpan 11 general developmental stages of brain samples and b BrainSpan 29 differentes ages of brain data. Genes are ordered by expression clusters and brain samples and ages by alphabetical order. MMP12 is not shown due to low expression levels in GTEx v8; c HumanBase gene network for MAPT, NKX2-2 and PTPRE and functionally interactors in brain tissue (GIANT software); d Bar graph of enriched associated human diseases across input gene list, colored by p-values.
This content was originally published here.