One hundred and eight children were enrolled in our retrospective studies. Study 1 (Fig. 2a) is composed of 38 children on the autism spectrum (1 girl; 8.5 ± 0.25 years) and 24 TD children (12 girls; 8.2 ± 0.32 years), and Study 2 (Fig. 3a) additionally includes 21 children with DLD (9 girls; 7.9 ± 0.51 years) and 25 children displaying severe-to-profound sensorineural hearing loss fitted with CIs (8 girls; 8 ± 0.22 years). Data of 24 children were excluded from the analysis (see Experimental protocol and data acquisition). Therefore, the final sample comprised 84 children distributed as follows: 29 ASD (0 girl; 8.4 ± 0.29 years; age range [6.3 12]; ADOS severity score: 6.19 ± 0.45; CARS: 27.7 ± 0.7), 20 TD (10 girls; 7.99 ± 0.33 years; age range [6 10.5]), 20 CI (6 girls; 8.2 ± 0.19 years; age range [6.5 9.9]; 12 with bilateral CI; 6 with right CI; 2 with left CI; age at first implantation 1.86 ± 0.15) and 15 DLD (7 girls; 8.2 ± 0.37 years; age range [6.5 10.8]). Demographic and clinical information regarding the final samples are presented in Table 1. Youth with ASD received an expert clinical diagnosis based on Diagnostic and Statistical Manual of Mental Disorders – fifth Edition – (DSM-V) [33]; the Autism Diagnostic Interview-Revised [34], and/or the Autism Diagnostic Observation Schedule [35] were used by experienced clinicians of the Excellence Center of Autism (Exac·t), Tours, France to inform diagnostic decisions. Children with DLD also received an expert clinical diagnosis based on the DSM-V [33] Nonverbal cognitive abilities were assessed either by Raven Progressive Matrices or Block Design and Matrix Reasoning of the WISC-IV (data of 5 TD children are missing). Only children with a minimum Mean Length of Utterances of 2.5 were included in the study [36] to ensure that language tests could be administered.

a Procedure of inclusion of the participants and random dichotomization of the data in diagnostic model group and unknown data group. NRT: Nonword Repetition Task; ASD: Autism Spectrum Disorder/cyan; TD: typically developing children/blue. b Extrapolation of the classification on 100 subjects. Participants with good diagnosis are surrounded by a green rectangle (93%), the misclassified by a red one. c Illustration of the acoustic profile by radar chart according to the four most significant voice features, namely, harmonic-to-noise ratio (HNR), formant frequencies 1 (F1), skewness of Jitter [s(Jitter)] and Shimmer generated the best ROC-supervised KCA setting; individual data are displayed in gray.
a Procedure of inclusion of the participants and random dichotomization of the data in diagnostic model group and unknown data group. NRT: Nonword Repetition Task; ASD: Autism Spectrum Disorder/cyan; TD: typically developing children/blue. b Extrapolation of the classification on 100 subjects. Participants with good diagnosis are surrounded by a green rectangle (93%), the misclassified by a red one. c Illustration of the acoustic profile by radar chart according to the four most significant voice features, namely, harmonic-to-noise ratio (HNR), formant frequencies 1 (F1), skewness of Jitter [s(Jitter)] and Shimmer generated the best ROC-supervised KCA setting; individual data are displayed in gray.

a Procedure of inclusion of the participants and random dichotomization of the data in diagnostic model group and unknown data group. OD: Other Disorders; NRT: Nonword Repetition Task; ASD: Autism Spectrum Disorder/cyan; CTRL: heterogeneous control group (composed of children with developmental language disorder [DLD], violet, and cochlear implant, pink [CI]). b Extrapolation of the classification on 100 subjects. Participants with good diagnosis are surrounded by a green rectangle (84%), the misclassified by a red one. c The top two most significant voice features, namely, formant frequencies 1 (F1) and Shimmer generated the best ROC-supervised KCA setting are plotted against each other.
a Procedure of inclusion of the participants and random dichotomization of the data in diagnostic model group and unknown data group. OD: Other Disorders; NRT: Nonword Repetition Task; ASD: Autism Spectrum Disorder/cyan; CTRL: heterogeneous control group (composed of children with developmental language disorder [DLD], violet, and cochlear implant, pink [CI]). b Extrapolation of the classification on 100 subjects. Participants with good diagnosis are surrounded by a green rectangle (84%), the misclassified by a red one. c The top two most significant voice features, namely, formant frequencies 1 (F1) and Shimmer generated the best ROC-supervised KCA setting are plotted against each other.
This study was carried out in accordance with the recommendations of the local ethics committee (Comité de Protection des Personnes [CPP] Tours Ouest 1, n°2006-RS), with written informed consent from all parents of the children and assent from the children, in accordance with the Declaration of Helsinki.
Experimental protocol
Acoustic data were extracted from 20 speech samples recorded in the context of a nonword repetition task [32], therefore reducing the influence of social interaction in voice production. The task focuses on complex phonological structures that have been identified as the source of errors in children with impaired phonology. Briefly, children had to repeat 50 or 70 nonwords of varying phonological complexity, presented with a computer either with only auditory or with both audio and visual information. Nonwords were created using 1, 2 or 3 of the three most common vowels among the languages of the world, namely [a], [i], [u], and from a concise list of consonants which included two stops ([k], [p]), two fricatives ([f], [s]), one liquid [l]. Nonwords had a maximum of 3 syllables to limit the influence of working memory on the repetition task. Nonwords had different syllable complexity: either a simple consonant vowel syllables, syllables with a final consonant or syllables with initial and median consonant clusters [32]. Phonological analysis of the data presented in the current manuscript are published elsewhere [37, 38]. Among the 50 or 70 nonwords, the 20 ones with less phonological errors were chosen for acoustical analysis (see the audio material of non-words retained in the study on the OSF platform). The NRT took place in a quiet room and audio were digitally recorded using Zoom H4 microphones put on a table in front of the child. Overall performance in the NRT task is presented in the results section and was analyzed with a 1 factor Welch ANOVA.
Acoustic measurements
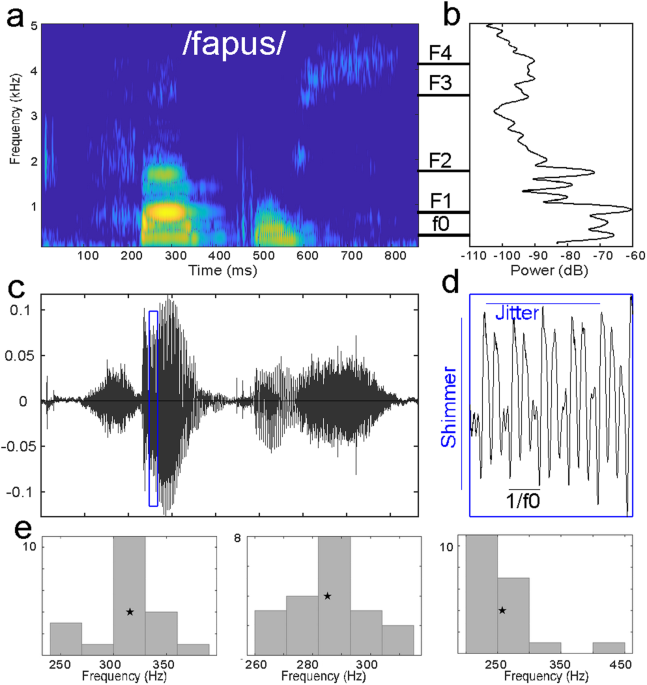
Acoustic parameters were analyzed using the open-source software Praat [39]. For each nonword, we extracted 9 acoustics parameters (Fig. 1): mean fundamental frequency (f0), mean formant frequencies (F1 to F4), mean formant dispersion (FD), mean harmonic-to-noise ratio (HNR), mean jitter (cycle-to-cycle variation in frequency of f0) and mean shimmer (cycle-to-cycle variation in intensity of f0).
Start and end of the non-word were identified visually, and average values of the frequency parameters (f0, and formant values) were measured on the total length of the non-word. To measure f0, a Pitch object was created with the following parameters: time step = 0.01 s, pitch floor = 90 Hz; pitch ceiling = 600 Hz. To measure formant frequencies, a Formant object using the Burg method was created with the following parameters: time step = 25% of window length, maximum number of formants = 5, maximum formant = 6500 Hz; window length = 0.025, pre-emphasis from 50 Hz. Formant dispersion was calculated as the average difference between formants.
Evaluation of periodicity-related parameters were performed on the 50% central part of the non-word, that is on an interval staring at the start point plus 25% of non-word duration and ending at the end point minus 25% of non-word duration. Mean HNR was measured on the Harmonicity object based on a forward cross-correlation analysis; the Harmonicity object was created with the default parameter values except for minimum pitch which was set to 90 Hz. Jitter and shimmer were measured on the Point process (periodic, cross-correlation) object with 90 Hz and 600 Hz as minimum and maximum pitch, respectively. Jitter is measured as the relative average perturbation using default parameter values (e.g., shortest period = 0.0001, longest period = 0.02, maximum period factor = 1.3). Shimmer (local, dB) was measured as the average absolute base-10 logarithm difference between the amplitudes of consecutive periods, multiplied by 20 with the same parameters than jitter and 1.6 as the maximum amplitude factor.
Parameters were then averaged across the 20 nonwords. In addition, because ASD is characterized with increased intra-individual variability [22, 40, 41], shape parameters (e.g., skewness and kurtosis) of f0, FD, HNR, jitter and shimmer were computed using Matlab2018b functions, leading to 19 variables (Fig. 1). Note that in the Matlab kurtosis function, the normal distribution has a kurtosis value of 3 (Fig. 1e).
Acoustic data are excluded according to two categories of rejection criteria: the nonword repetition task performance and acoustic rejection. For the first criteria, children whose performance in the repetition of vowels was considered outlier ([Q1-1.5xIQR] with Q1: lower quartile and IQR: interquartile range) were removed from the analysis (N = 9: 2 ASD, 2 DLD, 5 CI), to avoid bias due to the mispronunciation of certain vowels which can influence acoustics. For the second criteria, based on acoustical analysis (recording quality or outlier value of acoustic parameters with respect to the population), another 15 children (7 ASD; 4 DLD; 4 TD) were excluded from the analysis (ROC-supervised k-Means classification results including all participants but those with poor recordings quality are shown in Supplementary table 2).
Development of clustering diagnostic model
Code used in this manuscript is available on osf (https://osf.io/veqpz/). Our goal was to determine if acoustic features of the voice could be used as a feature classification specific for autism by k-Means classifying ASD against typical and other atypical development, thus we randomly dichotomized data in a diagnostic model group (train set) and an unknown data group (test set). To validate our model performance, we used a Monte Carlo cross-validation algorithm. Note that this method is robust to imbalance gender across groups; indeed, with a clustering approach, if gender were an important factor the two identified clusters would reflect gender separation rather than diagnostic group.
To develop the diagnostic model, within the Monte Carlo cross-validation, we randomly selected n ASD and n control as train data (70% of data) to which we applied a k-Means clustering algorithm (50 iterations, Hartigan & Wong algorithm); this was repeated 500 times with random subsampling of the data from the entire population, e.g., Monte Carlo cross-validation. Because there is no general rule regarding the number of repetitions to use, we choose the value at which our main criteria (selectivity and sensitivity) appear stable beyond reasonable doubt, through multiple testing with different numbers of resampling (Supplementary Fig. 1). The number of clusters was set to two, since we aimed to determine ASD diagnostic against a control population (TD children only, or control children). We performed k-Means clustering analysis (KCA) in an unsupervised way with the nine acoustic and derived acoustic variables (N = 19) and assessed its performance. Then, in order to enhance our KCA, we performed ROC as proposed by Nikas and colleagues 25and used an AUC (Area Under the Curve) ROC curve, as measure of separability to evaluate the most discriminative acoustic parameters. This latter probability is an assessment of the discriminative power of a given variable with respect to two measures, here the two groups involved. For example, with a given variable, an AUC of 1 is synonym of a separation between groups with 100% accuracy, and the given variable is considered as a perfect classifier. On the contrary, the worst discrimination between the two groups has an AUC = 0.50 (i.e., no discrimination capacity). In this way, the ROC curve allows us to optimize our KCA by supervising it using acoustic variables with the best discriminative performance. We used a threshold of AUC > 0.80 (80%) corresponding to a good discrimination [42].
This model was then tested to identify the diagnostic group of the test data (30% of the entire data, corresponding to the data not used in model building) according to their KCA classification, for each of the 500 bootstrap replications. To realize this, test data were added one-by-one for each participant and classified by supervised and unsupervised KCA. Hence, diagnostic of the participant was classified based on its data; accuracy was measured as the total number of correct classifications over the total number of classifications.
To assess the performance of our KCA, we measured selectivity, sensitivity and the classification performance of our model. Moreover, goodness of fit, an evaluation of clustering efficiency and of KCA quality, was assessed using the percent of variation (PV), a measure of corresponding to the total within-cluster sum of squares by the total of within and between-cluster sum of squares. Mean values derived from the 500 repetitions linked to the Monte Carlo cross-validation and their associated standard errors are reported for percent variation, selectivity, and sensitivity. Mean values and confidence intervals (95%CI) of classification accuracy was derived from the Monte Carlos cross-validation algorithm.
This content was originally published here.