General developmental profiles of infants at elevated- and low-likelihood of ASD
General developmental profiles of infants were evaluated using the MSEL test at 5 and 36 months of age, and with ADOS-2 at 36 months of age. Key confounding perinatal factors such as antibiotic exposure, preterm birth and medical conditions were excluded during enrollment. Additionally, maternal age, family income, and parental education level did not differ between the EL and LL groups (Supplementary Table I).
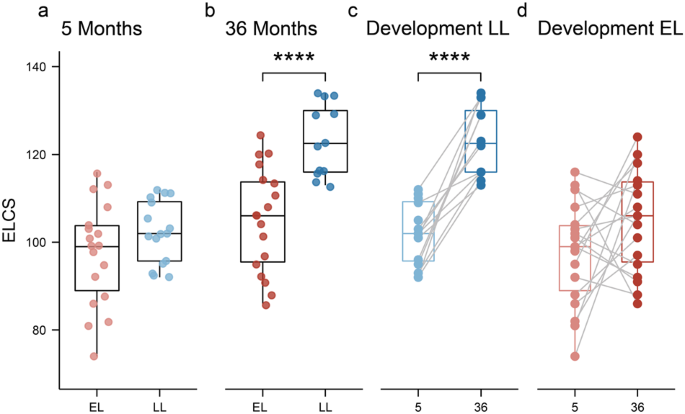
At 5 months, the Early Learning Composite Scores (ELCS, which is an age-adjusted standard score) of the MSEL were not significantly different between the EL and LL groups (Fig. 1a). However, at 36 months of age, the LL group had significantly higher ELCS compared to the EL group (Fig. 1b; Wilcoxon test, p = 0.0002). Additionally, the LL group had a significant increase in the ELCS between 5 and 36 months of age (Fig. 1c), while this was not the case for the EL group (Fig. 1d). In fact, the ELCS of seven infants in the EL group decreased with age, whereas all infants in the LL group increased with age. At 36 months of age, the overall ADOS-2 scores were significantly higher in the EL group compared to LL group (EL: 6.8 ± 2.484 vs. LL: 4.3 ± 2.720; mean ± SD; Wilcoxon test, p < 0.05). However, none of the infants were diagnosed with ASD according to the DSM-5 criteria at 36 months of age.

Infants were assessed using the MSEL test at 5- and 36-months of age. a At 5 months of age, no significant differences were observed between groups. b At 36 months of age, the elevated-likelihood group had a significantly lower ELC scores compared to the low-likelihood (p = 0.0002). c Infants in the low-likelihood group had a significant increase in their ELC scores between 5 and 36 months, while this developmental change was not observed in the elevated-likelihood group (d). Boxplots represent first (lower), median and third (upper) quartile. Wilcoxon test: ***p < 0.001. ELCS Early Learning Composite Scores, EL elevated-likelihood, LL low-likelihood.
Infants were assessed using the MSEL test at 5- and 36-months of age. a At 5 months of age, no significant differences were observed between groups. b At 36 months of age, the elevated-likelihood group had a significantly lower ELC scores compared to the low-likelihood (p = 0.0002). c Infants in the low-likelihood group had a significant increase in their ELC scores between 5 and 36 months, while this developmental change was not observed in the elevated-likelihood group (d). Boxplots represent first (lower), median and third (upper) quartile. Wilcoxon test: ***p < 0.001. ELCS Early Learning Composite Scores, EL elevated-likelihood, LL low-likelihood.
Early-life differences in the gut microbiota composition and diversity between infants at elevated- and low-likelihood of ASD
Longitudinal fecal samples from 35 children (19 EL and 16 LL) from 5 to 36 months of age were analyzed by shallow shotgun metagenome sequencing yielding an average of 1,130,684 reads per sample. The number of unique OTUs detected after filtering was 1040. At 5 months, two samples from the LL group were identified as strong outliers and removed from downstream analysis. One sample was dominated by Clostridium neonatale (59% of the total relative abundance), while the other sample was dominated by Klebsiella oxytoca (44% of the total relative abundance).
The overall gut microbiota composition at genus level of infants from the two different groups during the first 3 years of life is shown in Supplementary Fig. 1. Significant differences were observed in the estimated alpha-diversity (Shannon’s diversity index) between the two groups across all timepoints (DivNet, p < 0.001; Fig. 2a), with higher alpha diversity observed in the EL group during the first 14 months of life, but lower diversity thereafter (i.e., between 24 and 36 months). There were distinct differences in the developmental trajectory of alpha-diversity across the two groups. In the LL group, alpha-diversity gradually increased during the first year of life, reaching a plateau at 24 months. In contrast, the EL group showed a pronounced increase in alpha diversity between 5 and 10 months before a moderate decline between 24 and 36 months of age.

a Infants at elevated-likelihood of ASD showed higher alpha diversity during the first year of life, but lower diversity thereafter compared to the low-likelihood group. Dots represent mean estimate per group and whiskers show standard errors. b At 5 months of age, the low-likelihood group presented more Bifidobacterium species (B. breve, B. Bifidum, B. Longum, and B. kashiwanohense), while the elevated-likelihood group harbored more Clostridium related species (C. clostridioforme, C. neonatale, C. difficile, and C. bolteae), B. producta, R. gnavus, and K. variicola. Positive effect sizes indicate higher abundance in the low-likelihood group, while negative effect sizes indicate a greater presence of the taxon in the elevated-likelihood group. Displayed OTUs have p < 0.05 and a circle stroke indicates if the adjusted p value was <0.25. c At 36 months of age, none of the OTUs had an adjusted p value < 0.25, but several species that were more abundant in the low-likelihood group (A. senegalensis, A, timonensis, and I. butyriciproducens), as well as different Bacteroides species that were more abundant in the elevated-likelihood group had absolute effect sizes >0.5. d At 5 months of age, infants at elevated-likelihood of ASD presented significantly less Bifidobacterium, and more Clostridioides and Clostridium compared to infants at low-likelihood of autism. e At 5 months of age, infants at elevated-likelihood of autism had a significantly lower Bifidobacterium/Clostridium ratio compared to the low likelihood one. Boxplots (d, e) represent first (lower), median and third (upper) quartile. Wilcoxon test: *p < 0.05, **p < 0.01. ELCS Early Learning Composite Scores, EL elevated-likelihood, LL low-likelihood.
a Infants at elevated-likelihood of ASD showed higher alpha diversity during the first year of life, but lower diversity thereafter compared to the low-likelihood group. Dots represent mean estimate per group and whiskers show standard errors. b At 5 months of age, the low-likelihood group presented more Bifidobacterium species (B. breve, B. Bifidum, B. Longum, and B. kashiwanohense), while the elevated-likelihood group harbored more Clostridium related species (C. clostridioforme, C. neonatale, C. difficile, and C. bolteae), B. producta, R. gnavus, and K. variicola. Positive effect sizes indicate higher abundance in the low-likelihood group, while negative effect sizes indicate a greater presence of the taxon in the elevated-likelihood group. Displayed OTUs have p < 0.05 and a circle stroke indicates if the adjusted p value was <0.25. c At 36 months of age, none of the OTUs had an adjusted p value < 0.25, but several species that were more abundant in the low-likelihood group (A. senegalensis, A, timonensis, and I. butyriciproducens), as well as different Bacteroides species that were more abundant in the elevated-likelihood group had absolute effect sizes >0.5. d At 5 months of age, infants at elevated-likelihood of ASD presented significantly less Bifidobacterium, and more Clostridioides and Clostridium compared to infants at low-likelihood of autism. e At 5 months of age, infants at elevated-likelihood of autism had a significantly lower Bifidobacterium/Clostridium ratio compared to the low likelihood one. Boxplots (d, e) represent first (lower), median and third (upper) quartile. Wilcoxon test: *p < 0.05, **p < 0.01. ELCS Early Learning Composite Scores, EL elevated-likelihood, LL low-likelihood.
Infants at elevated-likelihood of ASD harbor less Bifidobacterium species and more Clostridium related species
Unconstrained ordination using PCA of CLR-transformed OTU counts showed a clear time-dependent development (PERMANOVA, R2 = 0.2 and p = 0.001) of the infant gut microbiota during the first three years of life (Supplementary Fig. 2). The variance between the individuals was greater during early life (5 and 10 months) than in the later sampling points (PERMDISPER, p = 3.59 × 10⁻¹⁵). Variation related to sampling age was captured in the first principal component. Inspection of the variables positively and negatively correlated with PC1 (absolute correlation > 0.7) indicated that bacteria belonging to the Ruminococcaceae, Lachnospiraceae, Clostridiaceae, Eubacteriaceae and Rikenellaceae families increased with age. Early timepoints were characterized by a higher abundance of taxa belonging to the Enterobacteriaceae and Veillonellaceae families (Supplementary Table 2).
Further analysis revealed significant differences in the microbial profiles between EL and LL groups at 5 and 36 months of age (PERMANOVA, R2 = 0.07 and p = 0.014, R2 = 0.04 and p = 0.015 respectively; Supplementary Fig. 3). To identify the OTUs driving the observed differences in the ordination analysis, differential abundance analysis was performed with ALDEx2. OTUs with p < 0.05 were retained and effect sizes were plotted. Taxa with adjusted p values < 0.25 after Benjamini–Hochberg correction were highlighted and considered significant. Effect sizes between 0.5 and 1 were considered of biological significance for group sample size of 20 [43]. At 5 months, the microbial profiles of infants in the EL group comprised significantly lower amounts of Bifidobacterium species (Bifidobacterium breve, Bifidobacterium bifidum, Bifidobacterium longum, Bifidobacterium kashiwanohense, and an unclassified species from the Bifidobacterium genus) compared to the LL group (Fig. 2b). Additionally, the EL group was characterized by a higher abundance of Clostridium related species including Clostridium clostridioforme, Clostridium neonatale, Clostridioides difficile and Clostridium bolteae, as well as Blautia producta, Ruminococcus gnavus and Klebsiella variicola, compared to the LL group. Consistent with the species level analysis, the analysis at the genus level showed significant changes in the Bifidobacterium, Lactobacillus, Clostridium and Clostridioides genera between the two groups. At 5 months of age, the EL group also had a significantly higher abundance of Coprobacillus and Erysipelatoclostridium, but a lower abundance of Alistipes and Parabacteroides compared to the LL group.
Although none of the differentially abundant OTUs at 36 months were significantly different between the two groups after BH correction (p adjusted > 0.25), an effect size >0.5 was observed for some of the taxa (Fig. 2c). The EL group presented a lower abundance of Alistipes senegalensis, Alistipes timonensis, Intestinimonas butyriciproducens, and Bifidobacterium bifidum compared to the LL group, but a greater abundance of several Bacteroides species.
Higher abundance of the Clostridium and Clostridioides genera and lower presence of Bifidobacterium in the EL group was also confirmed through univariate analysis (Wilcoxon test, p < 0.05). Boxplots highlighted the presence of 4 outliers within the EL group with a large abundance of Clostridium and Clostridioides (Fig. 2d). Three of the identified subjects also presented the lowest amount of Bifidobacterium compared to the other subjects in the same group. As expected, the Bifidobacterium/Clostridium ratio was also significantly lower in the EL group compared to the LL group (Fig. 2e).
Gut metabolome time-dependent development mirrors gut microbiome development
Analysis of the metabolites extracted from the longitudinal fecal samples of infants at elevated- and low-likelihood of ASD show a time-dependent development of the fecal metabolome during the first three years of life (PERMANOVA, R2 = 0.2 and p = 0.001; Supplementary Fig. 4). Variance within each timepoint progressively reduced through time. Fecal samples collected at earlier timepoints contained greater amounts of energy-related metabolites like formate, lactate, pyruvate, and metabolites derived from breast milk, including human milk oligosaccharides (HMOs), fructose, and galactose. No differences were noted in HMOs across the study groups, consistent with the parent reports, indicating no variation in breastfeeding between EL and LL infants. Samples collected at later timepoints contained greater amounts of isovalerate, valerate, urocanate, trimethylamine (TMA), and two unknown metabolites (doublet at 0.86 ppm and triplet at 0.85 ppm, both correlated to valerate) tentatively identified as isocaproate and valproate.
Infants at elevated-likelihood of ASD excrete lower amounts of fecal GABA at 5 months of age
Differences were observed in the fecal metabolomic profiles between elevated- and low-likelihood infants 5 to 36 months of age. Sparse PLS-DA models were generated with the integrated metabolites, and the loadings for metabolites with VIP > 1 were extracted. At 5 months, infants from the LL group were characterized by a greater presence of GABA and the energy-related metabolites, formate, lactate, and pyruvate, while the EL infants excreted greater amounts of butyrate and isoleucine (Fig. 3a). Univariate analysis confirmed these observations; with GABA abundance significantly lower in EL group compared to LL group (p < 0.05; Supplementary Fig. 5). In addition, butyrate appeared to be higher in the EL group, but not statistically significant (Supplementary Fig. 5).

Sparse PLS-DA models at 5- and 36-months of age were constructed with integrated metabolites from the full 1H NMR spectra. Metabolites with VIP > 1 were retained for the visualization of the loading plots of the first principal component. a GABA was identified as the main discriminatory metabolite driving the separation between infants at elevated- and low-likelihood of ASD at 5 months of age. b At 36 months, infants at elevated-likelihood of ASD presented more succinate, tryptophan, maltose, and glucose and less sarcosine compared to infants in the low-likelihood group. c Developmental changes in GABA and d tryptophan concentrations in infants at elevated- and low-likelihood of ASD. Group centroids are represented as * and ellipses represent 95% confidence interval. EL elevated-likelihood, LL low-likelihood.
Sparse PLS-DA models at 5- and 36-months of age were constructed with integrated metabolites from the full 1H NMR spectra. Metabolites with VIP > 1 were retained for the visualization of the loading plots of the first principal component. a GABA was identified as the main discriminatory metabolite driving the separation between infants at elevated- and low-likelihood of ASD at 5 months of age. b At 36 months, infants at elevated-likelihood of ASD presented more succinate, tryptophan, maltose, and glucose and less sarcosine compared to infants in the low-likelihood group. c Developmental changes in GABA and d tryptophan concentrations in infants at elevated- and low-likelihood of ASD. Group centroids are represented as * and ellipses represent 95% confidence interval. EL elevated-likelihood, LL low-likelihood.
At 36 months, the fecal metabolomes of the two study groups were also found to differ. A greater excretion of succinate, tryptophan, maltose, and glucose was observed in the EL infants whereas the LL infants excreted greater amounts of sarcosine (Fig. 3b). Observations were also confirmed through univariate analysis (Supplementary Fig. 5).
A microbiome-metabolome network was constructed using Spearman correlations between CLR-transformed OTUs and log-transformed integrated metabolites at 5 months. Only correlations with adjusted p value < 0.25 were retained during the construction of the full network (Supplementary Fig. 6). To simplify visualization, only Bifidobacterium and Clostridium related species of interest were plotted, together with the significantly correlating metabolites (Fig. 4a). Bifidobacterium species showed a strong positive correlation with GABA, acetate, and acetone. Some of the bifidobacteria were also positively associated with pyruvate and formate. Clostridium related species were strongly correlated with butyrate and glutamate and negatively correlated with acetone and lactate. Interestingly, GABA was positively correlated with acetate, acetone, lactate, and pyruvate and negatively correlated with glutamate and butyrate.

a Network constructed on CLR transformed OTUs and log transformed metabolites at 5 months of age using Spearman correlations. The full network was initially generated using all available OTUs and metabolites and correlations with adjusted p values < 0.25 were retained (full network available in Supplementary Fig. 6). To improve visualization, only Bifidobacterium and Clostridium species of interest and their correlated metabolites are displayed. GABA and acetate were positively correlated to the Bifidobacterium species of interest, while the Clostridium related species correlated with butyrate and glutamate. Red edges indicate positive correlations and blue edges indicate negative correlations. Edge width scaled on the absolute correlation values. b GABA can be produced through the GABA shunt, a closed-loop process that converts the α-ketoglutarate from the TCA cycle into glutamate, then GABA and finally into succinate, which re-enter the TCA cycle. GABA can also be produced from polyamines (e.g., spermidine and putrescine). Three different substrates (glutamate, putrescine, and spermidine) that can be converted into GABA were used in the Bifidobacterium and Clostridium cultures. c Bacterial isolates were cultured for 24 h in monocultures with the added substrate. B. breve and B. scardovii produced glutamate. GABA was produced by B. breve, B. adolescentis and B. scardovii, only when already present in the medium, and consumed by C. difficile and C. bolteae. Putrescine was consumed by Clostridium related species and produced by Bifidobacterium species, only when already present in the medium. No interactions with spermidine were observed. d A positive correlation was found between Bifidobacterium/Clostridium ratio and GABA concentration in fecal samples. e To determine whether the ratio of Bifidobacterium to Clostridium species. influenced the abundance of GABA, different growth conditions were investigated in vitro (Bifidobacterium spp.: Clostridium spp.; 2:1, 1:1, 1:2). GABA abundance was reduced to values comparable to that of the negative control (NC) when a greater proportion (2:1 Clostridium spp.: Bifidobacterium spp.) of Clostridium spp. were present in the cultures. Group means are plotted as line.
a Network constructed on CLR transformed OTUs and log transformed metabolites at 5 months of age using Spearman correlations. The full network was initially generated using all available OTUs and metabolites and correlations with adjusted p values < 0.25 were retained (full network available in Supplementary Fig. 6). To improve visualization, only Bifidobacterium and Clostridium species of interest and their correlated metabolites are displayed. GABA and acetate were positively correlated to the Bifidobacterium species of interest, while the Clostridium related species correlated with butyrate and glutamate. Red edges indicate positive correlations and blue edges indicate negative correlations. Edge width scaled on the absolute correlation values. b GABA can be produced through the GABA shunt, a closed-loop process that converts the α-ketoglutarate from the TCA cycle into glutamate, then GABA and finally into succinate, which re-enter the TCA cycle. GABA can also be produced from polyamines (e.g., spermidine and putrescine). Three different substrates (glutamate, putrescine, and spermidine) that can be converted into GABA were used in the Bifidobacterium and Clostridium cultures. c Bacterial isolates were cultured for 24 h in monocultures with the added substrate. B. breve and B. scardovii produced glutamate. GABA was produced by B. breve, B. adolescentis and B. scardovii, only when already present in the medium, and consumed by C. difficile and C. bolteae. Putrescine was consumed by Clostridium related species and produced by Bifidobacterium species, only when already present in the medium. No interactions with spermidine were observed. d A positive correlation was found between Bifidobacterium/Clostridium ratio and GABA concentration in fecal samples. e To determine whether the ratio of Bifidobacterium to Clostridium species. influenced the abundance of GABA, different growth conditions were investigated in vitro (Bifidobacterium spp.: Clostridium spp.; 2:1, 1:1, 1:2). GABA abundance was reduced to values comparable to that of the negative control (NC) when a greater proportion (2:1 Clostridium spp.: Bifidobacterium spp.) of Clostridium spp. were present in the cultures. Group means are plotted as line.
Regulation of GABA synthesis by Bifidobacterium and Clostridium species in vitro
To validate the statistical correlations between GABA and the discriminatory bacterial species, human isolates were grown in the presence of four different metabolites involved in the GABA pathway (Fig. 4b). Specifically, B. breve, B. bifidum, B. longum subsp. infantis, B. adolescentis, B. scardovii, C. difficile, and C. bolteae were cultured under anaerobic conditions in cell culture medium supplemented with either GABA, glutamate, putrescine, or spermidine.
Supernatants were collected after 24 h and analyzed by 1H NMR spectroscopy to assess the production and consumption of metabolites of interest (Fig. 4c). Both B. breve and B. scardovii produced glutamate when this amino acid was added to the culture medium (Fig. 4c). Consistent with the in vivo correlations, B. breve, B. scardovii, and B. adolescentis produced GABA, but exclusively when this neurotransmitter was added to the media (Fig. 4c), while the Clostridia related species. (e.g., C. difficile and C. bolteae) consumed it. All Bifidobacterium spp. produced putrescine, but only if this metabolite was supplemented to the medium. In contrast, Clostridia related species consumed putrescine. No interactions with spermidine were observed. Consistent with these in vitro observations, there was a positive correlation between GABA abundance and the Bifidobacterium/Clostridium ratio in the fecal microbiome of infants at 5 months of age (R = 0.56, p = 0.0026; Fig. 4d).
To assess whether the ratio of Bifidobacterium to Clostridium species influenced the abundance of GABA in the cultures, three growth conditions were studied (Bifidobacterium spp.: Clostridium spp.; 2:1, 1:1, 1:2). The species selected after initial experiments were B. breve, B. Infantis, C. difficile, and C. bolteae. To maintain GABA abundance around 4.5 mM, a higher initial ratio of Bifidobacterium species. was required (2:1; 1:1, Fig. 4e). Although this response was variable, GABA abundance was reduced to values comparable to that of the negative control (NC) when a greater proportion (2:1 Clostridium spp.: Bifidobacterium spp.) of Clostridium species were inoculated (Fig. 4e).
This content was originally published here.