Longitudinal European Autism Project (LEAP): design, participant selection, and clinical characterization
The present study was performed under the framework of the “European Autism Interventions—A Multicentre Study for Developing New Medications (EU-AIMS)” project. Funded by the European community, EU-AIMS was designed to identify ASD markers to enhance earlier and more accurate diagnosis and prognosis as well as the development of new therapies. More specifically the EU-AIMS Longitudinal European Autism Project (LEAP) aims to identify risk factors that contribute to differences in brain development, difficulties in social behavior, and other core ASD symptoms. Consequently, an accelerated longitudinal design was used. Four sub-cohorts of ASD individuals and non-autistic controls, defined by age and intellectual quotient (IQ), were recruited concurrently i.e. (i) adults aged 18–30 years; (ii) adolescents aged 12–17 years; (iii) children aged 6–11 years with IQ in the typical range (75+); and (iv) adolescents and adults aged 12–30 years with mild intellectual disability (ID) (IQ 50–74). This approach allowed the investigation of the age range of interest in a shorter time period as compared to a single-cohort approach. The protocol and standard operation procedures (SOPs) of the LEAP study are accessible on https://www.eu-aims.eu/fileadmin/websites/eu-aims/ media/EU-AIMS_LEAP/EU-AIMS-LEAP_SOP_Study– Protocol.zip. The study was approved by national and local ethics review boards at each study site and is carried out under Good Clinical Practice (ICH GCP) standards.
Inclusion and exclusion criteria for ASD patients as well as for the typically developing (TD) group were as described previously [45, 46].
Participants were recruited between January 2014 and March 2017 across six European specialized ASD centers namely the: (i) Institute of Psychiatry, Psychology and Neuroscience, King’s College London (IoPPN/KCL, UK), (ii) Autism Research Centre, University of Cambridge (UCAM, UK), (iii) University Medical Centre Utrecht (UMCU, Netherlands), (iv) Radboud University Medical Centre (RUMC, Netherlands), (v) Central Institute of Mental Health (CIMH, Germany) and (vi) the University Campus Bio-Medico (UCBM) in Rome, Italy. In addition, twins discordant with ASD were recruited at the Karolinska Institute in Sweden. A variety of recruitment sources were utilized, including existing volunteer databases, existing research cohorts, clinical referrals from local outpatient centers, special needs schools, mainstream schools, and local communities.
The study sample of the LEAP cohort is comprised of genetic data on 1566 individuals from 698 families, including 51 from twin families.
For the present investigation, we designed a case-control study including ASD patients (without intellectual disability) and controls belonging to the TD group. Eligible ASD cases were all participants who have an IQ greater than 75 without any exclusion for missing clinical data. Parents and relatives were excluded from the analysis even if classed as having ASD. Moreover, given the well-known restricted anthropogenic distribution of HLA diversity, only subjects of European descents were kept in the analysis.
Genetic data from the LEAP cohort participants and their families were obtained for 1566 individuals (coming from 698 families, including 51 twin families). Their genotyping was performed at the “Centre National de Recherche en Génomique Humaine” (CNRGH) using the Infinium OmniExpress-24v1 BeadChip (721114 markers) from Illumina.
We performed a genetic quality control on the whole genetic LEAP cohort and the following SNPs were removed: 41,889 with missingness rate >2%, 17,832 from sexual chromosomes, 61,701 with minor allele frequency <1% and 459 with departure from Hardy–Weinberg equilibrium (HWE) with p value < 10−6 for controls and p value < 10−10 for cases. For individual quality control of the 1566 ASD participants, 28 individuals were removed when data missingness rate per individual >2%, and 3 individuals removed with sex discrepancies, with no individuals removed for a heterozygosity rate issue. Finally, we obtained 599,233 SNPs for 1535 individuals.
To evaluate the potential impact of the genetic diversity on ASD severity, we used the following psychometric tools from among those utilized in the LEAP clinical evaluation: (i) the Autism Diagnostic Interview (ADI) [42], with its 3 domains—social, restricted and repetitive behaviors (rrb) and communication difficulties; (ii) the Autism Diagnostic Observation Schedule (ADOS) [43] Calibrated Severity Scores (CSS) total, social affect and rrb; (iii) the SSP (Short Sensory Profile) [47] total score for quantifying sensory processing disorder in ASD patients; (iv) the Strength and Difficulties Questionnaire (SDQ) externalizing score [48]; (v) the Social Responsiveness Scale [44] T-score, as a quantitative phenotype of autistic traits; (vi) DAWBA scores [49] for depression, anxiety, Attention Deficit—Hyperactivity disorders (ADHD) and score for internalizing and externalizing behaviors; and (vii) the full-scale IQ.
HLA imputation was performed using the SNP2HLA software [39]. This bioinformatic tool allows researchers to impute from the chromosome 6 genotypic data of each patient, namely: (i) the HLA class I and class II-classical alleles at a 4-digit level; (ii) the amino acid variants from the imputed 4-digit HLA alleles; and (iii) the SNPs of the entire MHC region.
As well as the single SNP effect, we also analyzed the potential impact of haplotypes involving the most significant SNPs. In addition, we looked for the possible effects of composite haplotypes involving the SNPs along the neighboring class II-classical HLA alleles genes, namely HLA-DQA1, HLA-DQB1, and HLA-DRB1. We also computed those having significant SNPs and suggestive HLA signals but failing to reach statistical significance. To this end, we used the package R HaploStats [50] to compute haplotypes. We obtained 508 haplotypes and as for the imputed variants, haplotypes with minor allele frequency < 0.03 were removed (N = 320) with PLINK [51].
We looked for genetic associations as to the risk to develop ASD among the 7403 imputed HLA variants and the 188 computed haplotypes. We compared ASD and TD for all the variants using a logistic regression implemented in PLINK software [51] under the additive, dominant, and recessive models. To correct for possible population stratification, we used the top four principal components (PC) as covariates in the statistical analyses. We also added gender and recruitment centers as covariates in our model. We used the Bonferroni method to correct for multiple testing. The statistical threshold of significance was set at 6.75 × 10⁻⁶, which was derived by dividing 0.05 by 7403 markers tested. This conservative threshold holds particular significance in our investigation due to the prominent presence of linkage disequilibrium (LD) in the MHC region. Through LD calculations, encompassing all variants in the region, we found a limited number of independent SNPs, i.e., 1349 (with a pruning based on a r2 value below 0.5). When considering the analysis for three different models (3 × 1349 = 4047 tests), the threshold became 1.24 × 10⁻⁵. However, for the sake of simplicity, we only retained the lowest threshold of 6.75 × 10⁻⁶ for all tests.
Initially, 1535 individuals (corresponding to 698 families) passed the genetic quality control procedures. After the selection of unrelated individuals from each family and stratification analysis (see Methods), the genotyping information from 528 unrelated individuals enrolled in the EU-AIMS/LEAP project (298 cases and 230 controls) were used for HLA imputation. Clinical and related information were available for 275 of the 298 cases. Socio-demographic characteristics are reported in Table 1 and showed a difference in the distribution according to gender, both in cases and in controls, where males were predominant (males: 71% for the ASD group and 63% for the controls). This distribution approached significance in comparison of cases and controls (p value = 0.053). Psychometric scores assessing clinical variables in ASD patients are reported in the supplementary Table S1.
SNPs and HLA association analyses
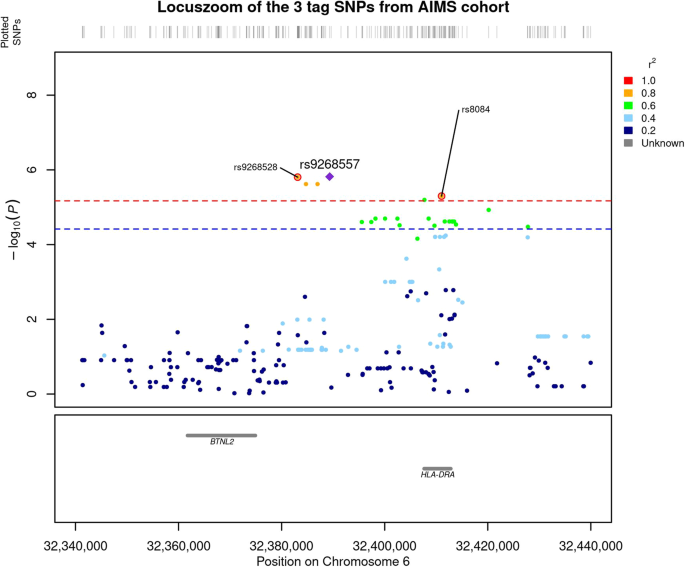
We compared the genetic distribution of MHC SNPs, HLA alleles, and amino acids in 298 individuals with ASD and without ID, versus 230 non-autistic controls in additive, dominant and recessive models. While no classical HLA allele passed the Bonferroni threshold, six SNPs i.e., rs9268528, rs9268542, rs9268556, rs14004, rs9268557, and rs8084 were significantly associated with ASD risk in the additive model (Fig. 1 and Table 2). Three of them, namely rs9268528, rs9268542, and rs9268556, also passed the Bonferroni threshold in the dominant model (Table 2). By analyzing the linkage disequilibrium (LD) among the 6 SNPs, we obtained the three following blocks of LD (Fig. 2): (1) rs9268528, rs9268542, rs9268556, rs14004; (2) rs9268557 and (3) rs8084. However, these 3 blocks were not completely independent, with comparisons among them showing an r2 greater than 0.4 and the D’ > 0.8 (Fig. 2). Block 1 (rs9268528-G, rs9268542-G, rs9268556-C, and rs14004-A) associated with a protective effect against ASD risk, whilst the two remaining two blocks, namely the rs9268557-T and the rs8084-A alleles, associated with enhanced ASD risk (Table 2). In the control group, the allelic frequencies of such ASD-associated SNPs were in agreement with that of the 1000 genomes European population diversity. Although the allelic frequencies of the 6 SNPs were not always the same across centers, the distribution between cases and controls was always in the same direction (supplementary Table S2). As to location, the rs8084 and rs14004 mapped to the HLA-DRA gene [respectively at the junction between the second intron and the third exon and in the 5’-untranslated region (UTR)], whilst the four others were intergenic variants, located in a region encompassing the BTNL2 (~10 kb) and HLA-DRA (~20 kb) loci (chr6: 32383108–32411035) (Fig. 1). Interestingly, beside these strongly associated variations, we also observed, in a recessive and a dominant manner respectively, two signals belonging to the HLA-DQB1 amino acids, namely a leucine at position 26 (DQB1-26-L) and a glycine at position 45 (DQB1-45–G) of the DQB1 heavy chain. While the two signals, although showing a strong association trend, failed initially to reach the established statistically significant threshold, we decided to investigate their possible implication in the modulation of ASD risk at haplotype level (see below).

The –log10(P value of association) were plotted according to the physical position of the SNPs. The genes of the region are annotated at the bottom of the figure. The dashed line corresponds to the Bonferroni threshold. The colors of the SNPs indicate the LD with the strongest SNP rs9268557 measured by r2 coefficient. The SNPs tagging the three blocks are indicated.
The –log10(P value of association) were plotted according to the physical position of the SNPs. The genes of the region are annotated at the bottom of the figure. The dashed line corresponds to the Bonferroni threshold. The colors of the SNPs indicate the LD with the strongest SNP rs9268557 measured by r2 coefficient. The SNPs tagging the three blocks are indicated.

The analysis of the linkage disequilibrium (LD) among the 6 SNPs shows three blocks of LD namely: (1) rs9268528, rs9268542, rs9268556, rs14004; (2) rs9268557 and (3) rs8084 which are not completely independent with an r2 greater than 0.4 and a D’ > 0.8.
The analysis of the linkage disequilibrium (LD) among the 6 SNPs shows three blocks of LD namely: (1) rs9268528, rs9268542, rs9268556, rs14004; (2) rs9268557 and (3) rs8084 which are not completely independent with an r2 greater than 0.4 and a D’ > 0.8.
Since the 3 SNPs tagging the 3 blocks (rs9268528-G, rs9268557-T, and rs8084-A) are close to each other (Fig. 1), we investigated for possible haplotype effects. Moreover, as located within the HLA class II region, we also searched for haplotype effects between them and the classical class II HLA alleles (i.e. belonging to the HLA-DQA1, DQB1, and DRB1 gene loci). Finally, we computed haplotypes involving the tag SNPs and the above-mentioned HLA-DQ beta-amino acids (DQB1-26-L and DQB1-45–G). We thus performed a logistic regression to compare the distribution of haplotypes in ASD patients and in controls with typical development, in the additive, dominant, and recessive models by means of the pipeline of analysis used for SNPs and HLA association analyses.
Interestingly, in the additive model, haplotypes consisting of DQB1-26-L or DQB1-45-G amino acids and rs9268528-A or rs9268557-T were strongly associated with ASD risk. Indeed, the comparison of their distribution between ASD cases and TD subjects yielded lower p values than the most significant SNP in the additive model (p values: 1.66 × 10−07 and 1.5 × 10⁻⁶, respectively). Consequently, the odds ratios were also increased (2.1 for the most significant haplotype vs 1.90 for the rs9268557-T alone). This effect is even stronger in the dominant model for the haplotypes bearing the DQB1-26-L (Table 3 and Fig. 3).
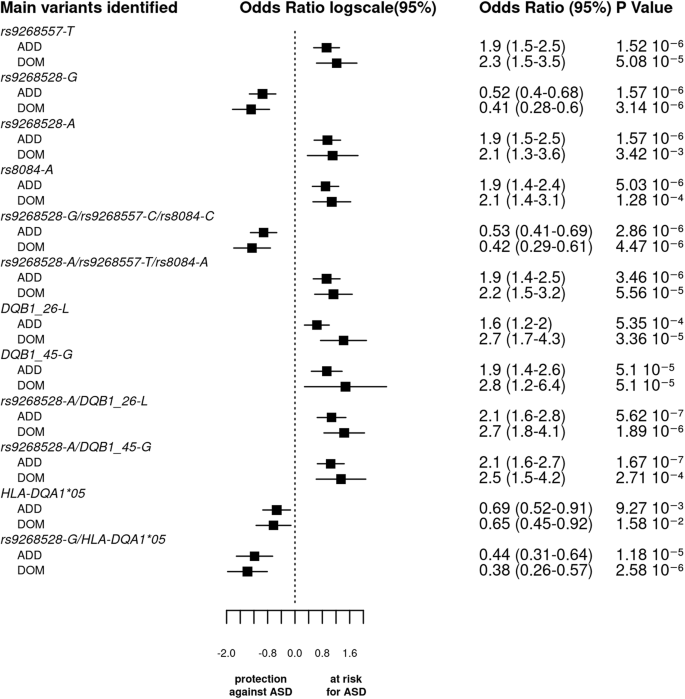
The bar graph displays the log odds ratios (OR) and their 95% confidence intervals (CI) for the main SNPs, haplotypes, and HLA (amino acid or classical alleles) based on the logistic regression analysis under both additive and dominant models. The vertical line represents the reference category. The horizontal bars represent the width of the 95% CI. The names of the variants are shown on the y-axis. The OR and p value are indicated on the right of the figure for each variant. As the p values of associations along odds ratio for the 3 tag SNPs haplotypes are comparable to that of the SNPs taken individually and since the 3 blocks of LD were not completely independent, we cannot conclude whether each variant by itself or their bearing haplotypes functionally drive ASD vulnerability.
The bar graph displays the log odds ratios (OR) and their 95% confidence intervals (CI) for the main SNPs, haplotypes, and HLA (amino acid or classical alleles) based on the logistic regression analysis under both additive and dominant models. The vertical line represents the reference category. The horizontal bars represent the width of the 95% CI. The names of the variants are shown on the y-axis. The OR and p value are indicated on the right of the figure for each variant. As the p values of associations along odds ratio for the 3 tag SNPs haplotypes are comparable to that of the SNPs taken individually and since the 3 blocks of LD were not completely independent, we cannot conclude whether each variant by itself or their bearing haplotypes functionally drive ASD vulnerability.
Again, in the additive model, we observed that the two haplotypes, including the 3 tag SNPs (rs9268528, rs9268557, and rs8084) have two opposing effects: with (rs9268528-G, rs9268557-C, rs8084-C) affording protection against ASD, whilst (rs9268528-A, rs9268557-T, rs8084-A) associated with enhanced ASD risk (Table 3 and Fig. 3). As the p values of associations along odds ratio for the two haplotypes are comparable to that of the SNPs taken individually and since the 3 blocks of LD were not completely independent, we cannot conclude whether each variant by itself or their bearing haplotypes functionally drive ASD vulnerability.
Further analysis of correlations between combined SNPs and classical HLA class II alleles allowed the identification of the following haplotypes: (i) the HLA-DQA1*05 allele with rs9268528-G or rs8084-C or rs9268557-C, that confer a protective status against ASD; (ii) the HLA-DQB1*06 variant allele with rs9268557-T which associates with raised ASD risk; and (iii) the HLA-DQB1*03 allele either with the rs9268557-C or with the HLA-DQA1*05 variant both conferring a protective effect (Table 3).
In the dominant model, we observed a strong association between ASD risk and haplotypes bearing the amino acid DQB1-26-L variant, namely DQB1-26-L-rs9268557-T, DQB1-26-L-rs9268528-A, DQB1-26-L-rs8084-A, and DQB1-26-L- rs9268557-T–rs9268528-A-rs8084-A. The observed at-risk effect was found to be stronger than in the additive model, suggesting a dominant effect of these haplotypes. The p value and the odds ratio for the protective haplotype harboring both rs9268528-G and HLA-DQA1*05 were lower than in additive model, suggesting that the conferred protective status against ASD could be exerted in a dominant manner.
Finally, in the recessive model, the only haplotype yielding a p value comparable to that of the individual SNPs is the at-risk haplotype combining the HLA-DQB1-45-G variant with the rs9268528-A allele.
Overall, the observed haplotype-derived at-risk/protective effects strongly suggest a genetic interplay between the genetic diversity of MHC SNPs (BTNL2) and HLA class II alleles or amino acid variants.
Functional analysis of the associated SNPs
Functionally, it is notable that the rs8084 variation creates a splice acceptor site leading to a 25 amino acid deletion of the HLA-DR alpha chain, which affects its molecular conformation and cellular localization [52].
Further screening of the RegulomeDB database [53], which reports information concerning the potential transcriptomic properties of genomic SNPs, indicated that 3 SNPs (rs9268528, rs14004, and rs8084) had a good RegulomeDB rank of 1 f (Supplementary Table S3). This makes their location within regulatory elements plausible and therefore their involvement in gene transcription, given that the probability to have a RegulomeDB score better than 1 f is less than 5% (data not shown). Thus, from the haplotype blocks only rs9268528 and rs14004 (block 1) and rs8084 (block 3) reached this 1 f score (Supplementary Table 2).
We also used the GTex portal [54] to uncover possible quantitative trait loci (eQTL) linked to rs9268528, rs9268557, and rs8084 SNPs that tag the 3 identified blocks. We focused on three tissues known to be involved in ASD pathophysiology namely: brain, small intestine, and whole blood (PBMCs). Figure 4 depicts the most expressed genes and their correlations to these 3 SNPs in the brain, small intestine, and PBMCs. P values were more significant in whole blood, versus brain and small intestine. For all tissues and SNPs, we observed an overexpression of HLA-DQA2. Interestingly, the protective rs9268528-G allele associated with under-expression of the HLA-DQB1 gene in the whole blood and brain (Fig. 4). Similarly, the HLA-DQA1 gene is also under-expressed in the whole blood in correlation with the rs9268528-G allele (p = 10−12, beta = −0.15, not shown in Fig. 4). Conversely, BTNL2, well known for its involvement in inflammatory gastrointestinal disorders, was overexpressed in the small intestine in correlation with the protective allele rs9268528-G. Overall, these observations may reflect the above-mentioned genetic interplay between genetically determined low expression of the HLA DQ genes and high expression of BTNL2 gene in conferring protection against ASD risk. Moreover, HLA-DRB6 overexpression correlated with the rs8084-C variant in the whole blood and brain, whilst HLA-DBR5 was under-expressed when combined with the rs9268557-C variant in the same tissues (Fig. 4). These observations reinforce the hypothesis that the observed tag SNPs may be having regulatory effects on HLA class II gene expression.

Graphical representation of the possible GTex-derived quantitative trait loci (eQTL) linked to the SNPs rs8084 (A), rs9268528 (B), and rs9268557 (C), that tag the identified LD blocks in the brain, small intestine, and PBMCs. P values are more significant in whole blood, versus brain and small intestine. For all tissues and SNPs, we observed an overexpression of HLA-DQA2. The protective rs9268528-G allele is associated with the under-expression of the DQB1 gene in the whole blood and brain. Conversely, BTNL2, well known for its involvement in inflammatory gastrointestinal disorders, is overexpressed in the small intestine in correlation with the protective allele rs9268528-G. HLA-DRB6 overexpression correlated with the rs8084-C variant in the whole blood and brain, whilst HLA-DBR5 was under-expressed when combined with the rs9268557-C variant in the same tissues.
Graphical representation of the possible GTex-derived quantitative trait loci (eQTL) linked to the SNPs rs8084 (A), rs9268528 (B), and rs9268557 (C), that tag the identified LD blocks in the brain, small intestine, and PBMCs. P values are more significant in whole blood, versus brain and small intestine. For all tissues and SNPs, we observed an overexpression of HLA-DQA2. The protective rs9268528-G allele is associated with the under-expression of the DQB1 gene in the whole blood and brain. Conversely, BTNL2, well known for its involvement in inflammatory gastrointestinal disorders, is overexpressed in the small intestine in correlation with the protective allele rs9268528-G. HLA-DRB6 overexpression correlated with the rs8084-C variant in the whole blood and brain, whilst HLA-DBR5 was under-expressed when combined with the rs9268557-C variant in the same tissues.
Regarding the DQB1 amino acids, it is notable that the leucine at position 26 is in the peptide binding groove of the HLA DQ heavy chain and is part of the pocket 4 known to be pivotal for antigen presentation and repeatedly implicated as a risk factor for the development of ‘autoimmune’ disorders, including those targeting the gastrointestinal tract [55], (Fig. 5). The DQB1-26L amino acid is shared by alleles belonging to the HLA-DQB1*02, HLA-DQB1*03, and HLA-DQB1*06 specificities, whilst the DQB1-45G amino acid tag alleles of the HLA-DQB1*02, HLA-DQB1*03, HLA-DQB1*04, HLA-DQB1*05, and HLA-DQB1*06 antigens.

The leucine at position 26 (DQB1-26L) which is located the pocket 4 is indicated by a red arrow. The DQB1-26L amino acid is shared by alleles belonging to the HLA-DQB1*02, HLA-DQB1* 03, and HLA-DQB1*06 specificities, whilst the DQB1-45G amino acid tag alleles of the HLA-DQB1*02, HLA-DQB1* 03, HLA-DQB1*04, HLA-DQB1* 05 and HLA-DQB1* 06 antigens.
The leucine at position 26 (DQB1-26L) which is located the pocket 4 is indicated by a red arrow. The DQB1-26L amino acid is shared by alleles belonging to the HLA-DQB1*02, HLA-DQB1* 03, and HLA-DQB1*06 specificities, whilst the DQB1-45G amino acid tag alleles of the HLA-DQB1*02, HLA-DQB1* 03, HLA-DQB1*04, HLA-DQB1* 05 and HLA-DQB1* 06 antigens.
SNP and haplotype influence on clinical characteristics in ASD patients
We then tested the potential influence of ASD-associated haplotypes and SNPs on ASD clinical presentation or severity for patients with available clinical annotations (N = 275). We, therefore, performed linear regression involving different psychometric tools assessed in the LEAP cohort, these scores were used to evaluate ASD characteristics and cognitive performance. Only trends toward association were observed between the genetic variants and the studied clinical scales (data not shown), highlighting the difficulties in comparing genetic traits with clinical symptoms that fluctuate over the course of a disorder.
This content was originally published here.