Shared genetic architecture (MiXeR)
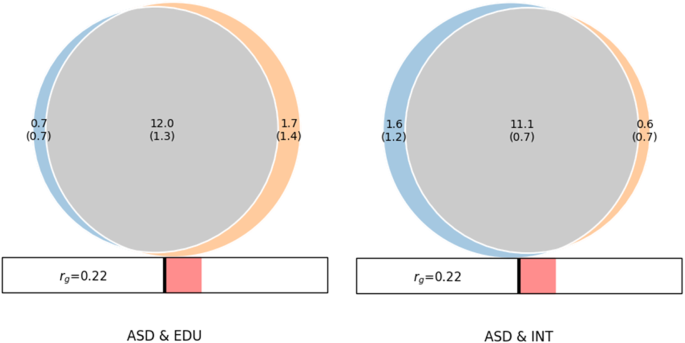
MiXeR revealed substantial amount of shared ‘causal’ variants between ASD&INT and ASD&EDU. As shown in the Venn diagram (Fig. 1), the estimated number of shared ‘causal’ variants between ASD and INT was 11.1k (SD = 0.7k), with 1.6k (1.2k) unique ASD variants and 0.6k (0.7k) unique INT variants. The Dice coefficient was 0.91 for variants shared between ASD and INT (Table S15). MiXeR estimated 12.0k (1.3k) shared ‘causal’ variants between ASD and EDU, with 0.7k (0.7k) unique ASD variants and 1.7k (1.4k) unique EDU variants. The Dice coefficient was 0.90 for variants shared between ASD and EDU (Table S15). The proportion of shared ‘causal’ variants with concordant effects for ASD&INT was 0.58 (SD = 0.004) and 0.58 (SD = 0.005) for ASD&EDU.

Venn diagrams from MiXer analyses shows the number of shared and trait-specific “causal” genetic variants in thousands for ASD & EDU and ASD & INT. The MiXeR estimated DICE coefficient for ASD & EDU was 0.90 and for ASD & INT it was 0.91. Both analyses had positive AIC values when comparing modeled estimates to minimum possible overlap but negative compared to maximum possible overlap, indicating that the estimates may underestimate genetic overlap. Rg: MiXeR estimated genome-wide genetic correlation.
Venn diagrams from MiXer analyses shows the number of shared and trait-specific “causal” genetic variants in thousands for ASD & EDU and ASD & INT. The MiXeR estimated DICE coefficient for ASD & EDU was 0.90 and for ASD & INT it was 0.91. Both analyses had positive AIC values when comparing modeled estimates to minimum possible overlap but negative compared to maximum possible overlap, indicating that the estimates may underestimate genetic overlap. Rg: MiXeR estimated genome-wide genetic correlation.
In the conditional Q–Q plots, we observed SNP enrichment for ASD as a function of the significance of SNP associations with EDU (Fig. 2a) and INT (Fig. 2b). The reverse conditional Q–Q plots also demonstrate consistent enrichment in ASD given associations with INT and EDU, indicating polygenic overlap between the phenotypes (Fig. S1a, S1b).

Conditional QQ plots of observed versus expected −log10 p-values in the primary trait (ASD) as a function of significance of genetic association with the secondary traits intelligence (a) and educational attainment (b) at the level of p ≤ 0.1 (red lines), p ≤ 0.01 (yellow lines) and p ≤ 0.001 (purple lines). Blue lines indicate all SNPs. Black dotted line is the expected Q–Q plot under the null hypothesis (no SNPs associated with the trait).
Conditional QQ plots of observed versus expected −log10 p-values in the primary trait (ASD) as a function of significance of genetic association with the secondary traits intelligence (a) and educational attainment (b) at the level of p ≤ 0.1 (red lines), p ≤ 0.01 (yellow lines) and p ≤ 0.001 (purple lines). Blue lines indicate all SNPs. Black dotted line is the expected Q–Q plot under the null hypothesis (no SNPs associated with the trait).
Log-likelihood plots are shown in Figs. S1a and S1b. The AIC values (Table S15) were positive when comparing modeled estimates to minimum overlap, but negative compared to maximum overlap for both ASD/INT and ASD/EDU analysis. This indicates that the MiXeR-predicted overlap is not distinguishable from maximum possible overlap, suggesting caution in interpreting the estimates from MiXeR. ASD and INT have LDSR-based genome-wide genetic correlation of rg = 0.22 (SD = 0.032, p = 4.60e−12) and MiXeR-estimated genetic correlation of shared variants of ρβ = 0.24 (SD = 0.01). For ASD and EDU, those values are respectively rg = 0.21 (SD = 0.028, p = 2.17e−13) and ρβ = 0.25 (SD = 0.02). This pattern of extensive genetic overlap but weak genetic correlation is indicative of mixed effect directions, supported by the MiXeR-estimated proportion of shared ‘causal’ genetic variants with concordant effects of 0.58 for both ASD&INT and ASD&EDU.
Identification of shared genetic loci (cond/conjFDR)
The conjFDR Manhattan plots are shown in Fig. 3a, b. At conjFDR < 0.05, we detected 19 genetic loci jointly associated with ASD and INT (Table S3), and among them, 11 are unique for ASD and INT. We detected 32 distinct genetic loci jointly associated with ASD and EDU (Table S4), of which 24 are unique for ASD and EDU. Eight loci were common for both ASD and EDU and ASD and INT, yielding a total of 43 distinct loci at conjFDR < 0.05. Of these SNPs, 18 were intronic, 13 intergenic, 11 non-coding RNA intronic and 1 exonic (see Tables S3 and S4).

The plots show common genetic variants jointly associated with ASD and intelligence (a) and ASD and educational attainment (b) with the –log10 transformed conjFDR values for each SNP on the y-axis and chromosomal positions on the x-axis. The black dotted horizontal line represents the threshold for significant shared associations (conjFDR <0.05, i.e. –log10 (conjFDR >1.3)). Independent lead SNPs are encircled in black.
The plots show common genetic variants jointly associated with ASD and intelligence (a) and ASD and educational attainment (b) with the –log10 transformed conjFDR values for each SNP on the y-axis and chromosomal positions on the x-axis. The black dotted horizontal line represents the threshold for significant shared associations (conjFDR <0.05, i.e. –log10 (conjFDR >1.3)). Independent lead SNPs are encircled in black.
Evaluation of allelic effect directions
Loci were either concordant or discordant as denoted by the sign of the effect, and 68% (13/19) of the shared loci between ASD and INT had concordant allelic effect directions (Table S3) and 59% (19/32) of the shared loci between ASD and EDU possessed concordant allelic effect directions (Table S4).
Local genetic correlations
LAVA analysis of 19 loci shared between ASD and INT revealed three loci (2q12.1, 5q22.3 and 14q32.33) with significant local heritabilities (p < 0.05/19) in both ASD and INT and nominally significant local genetic correlation (p < 0.05) (marked with green in Table S3), all being positive. For 32 loci shared between ASD and EDU, LAVA identified five loci (6q16.1, 6p21.32, 7p15.3, 14q32.33 and 17q21.31) with significant (p < 0.05/32) local heritabilities in both ASD and EDU and significant (p < 0.05) genetic correlation between them (marked with green in Table S4), four out of these five loci were positively correlated while one locus had negative correlation.
Novel ASD loci
As seen in Table S3, 11 of 19 the lead SNPS jointly associated with ASD and INT at conjFDR <0.05, were not identified in the original ASD GWAS [10], and 21 of the 32 loci jointly associated ASD and EDU were also novel (Table S4). Five of these loci were overlapping both with EDU and INT, which yielded a total of 27 novel ASD loci (Table 2).
Functional annotation (FUMA SNP2GENE)
We did functional annotation of all SNPs with a conjFDR value < 0.1 within loci shared between ASD & INT and ASD & EDU, which resulted in 2356 candidate SNPs jointly associated with ASD and INT (Table S5) and 1782 SNPs candidate SNPs jointly associated with ASD and EDU (see Table S6).
Gene-mapping
By using three different methods (positional, eQTL, and chromatin interaction) we mapped 104 genes from candidate SNPs within loci shared between ASD and INT (see Table S7) and 132 genes for ASD and EDU (see Table S8). Of these, there were 10 genes that were credible i.e., implicated by all three mapping strategies in analysis of ASD and EDU and all of these were also credible in analysis of ASD and INT, resulting in 16 credible mapped genes all together (see Fig. S9 and Table S16).
Gene-set enrichment and molecular function analysis (FUMA GENE2FUNC)
Gene expression in different tissues
Heatmaps of all genes annotated to candidate SNPs are shown in Fig. S4a (ASD and EDU) and Fig. S5a (ASD and INT). Candidate genes from ASD and EDU had significantly upregulated differentially expressed genes (DEGs) in four of 54 different tissues, namely brain cortex, frontal cortex, brain cerebellum and cerebellar hemisphere (Fig. S4b) and candidate genes from ASD and INT had significant upregulated DEGs two tissues: cerebellum and cerebellar hemisphere (Fig. S5b).
Gene expression during brain development periods
Candidate genes tended to have upregulated expression during early prenatal period and late infancy (Figs. S3c and S4c) but these differences were not significant.
Gene set enrichments
GO biological processes molecular function (Tables S9 and S10): Enrichment was found in 43 different gene sets, including positive regulation of central nervous system development, midbrain development, neuronal differentiation, synaptic signaling, neuron death, gliogenesis, astrocyte development, mitochondrion organization, synapse plasticity and more general pathways as inositol phosphate and response to reactive oxygen species,
Transcription factors
Candidate genes were enriched in the pathways of 100 transcription factors, of them HIF1 (hypoxia inducible factor 1), NFR1 (nuclear respiratory factor 1) and vitamin D receptor.
Immunologic signatures
Candidate genes were enrichments in 23 immune related gene sets for ASD and EDU, among them, Interleukin-2 and Interleukin-10 pathways, Macrophage Stimulating 1 (MSP1) pathway, EBNA1 anticorrelated, and development of regulatory T cells (Tregs).
GWAS gene sets
As seen in Tables S9 and S10, enrichment was seen in 100 different gene sets including ASD related social behaviors (attendance at social groups, helping behavior), cognitive function, mental/neurologic traits (short sleep, alcohol abuse, mood instability, schizophrenia, depression, neuroticism, intracranial volume, neurodegenerative diseases) and somatic traits (inflammatory bowel diseases, cardiovascular measures, lung function/pulmonary fibrosis, endocrine measures).
FUMA (GENE2FUNC) of concordant loci (Figs. S5–6 and Tables S11 and S13)
Heatmaps showing the tissue expressions of each gene in the concordant gene sets (ASD/EDU and ASD/INT) are shown in Figs. S5a–S6a. For ASD/INT, expression analyses showed that concordant genes were significantly differently expressed (DEGs) in 13 tissues, with highest DEGs in frontal cortex (Fig. S5b). Similar results were found for ASD/EDU, were DEGs were significantly less expressed in amygdala, hippocampus, basal ganglia, and substantia nigra. Highest upregulation (non-significant) was found in brain frontal cortex and cerebellum (Fig. S6b). Similar enrichment analyses as for the total gene sets were performed for concordant genes and showed that they were enriched in gene sets for extremely high intelligence, social traits (attending social groups and helping behavior), psychiatric disorders, inflammatory bowel diseases and immunological signatures (Tables S11 and S13). FUMA analyses of the 6 credible genes mapped from concordant loci (NCKIPSD, CCDC36, IP6K2, PRKAR2A, QRICH1, CCDC71) showed that they were enriched in pathways for inflammatory diseases and blood protein levels (Fig. S9a and Table S16).
FUMA GENE2FUNC of discordant loci (Figs. S7–S8 and Tables S12 and S14) showed that they were significantly upregulated (DEGs) in the cerebellum and cerebellar hemisphere (Figs. S7b and S8b). Discordant genes were enriched in several gene sets, including neurodegenerative diseases (incl. Alzheimer’s disease and Parkinson’s disease), chronic pain, alcohol use disorder and craniofacial macrosomia (small head and face) (Tables S12 and S14). For the credible mapped discordant genes (MAPT, CRHR1, WNT3, KANSL1, ARL17B, SPPL2C, LRRC37A, ARHGAP27, PLEKHM1, and STH) we found trends of similar enrichments as the total set of discordant genes (Fig. S9b and Table S16).
This content was originally published here.