All mice were bred and maintained in the animal facility of the Faculty of Medicine, Bar Ilan University, and experimental procedures were approved by Institute Animal Ethical Care and Use Committee (protocol number 16–8–2017). All mice are kept in a vivarium at 22 °C, on a 12 h light/dark cycle, with food and water available ad libitum. The C57BL/6 CHD8L +/− mice were as described by Katayama et al. [23], and have been previously phenotyped. The mice were kindly provided by Keiichi I. Nakayma, through Riken BRC mouse resource (Wako, Japan). C57BL/6 Chd8L+/− male mice were crossed with female WT mice to produce WT and C57BL/6 Chd8L+/− mice. To generate gut epithelial cell-specific CHD8 haploinsufficient mice, male villin-Cre+/− mice were crossed with female CHD8fl/fl mice. All offspring were CHD8fl/wt, and half the offspring were also villin-cre+/− (villin cre-positive). Cre-negative (WT) and Cre-positive (CHD8 floxed heterozygote) littermate offsprings were used in all experiments. Haploinsufficient mice were referred to as Chd8+/ΔIEC. The floxed CHD8 mice was purchased from Jackson Laboratories (stock number 031555). The test mice used in the experiments were always the first-generation offspring of the above-mentioned breeding schemes. Breeding was performed with the aim to produce 12 mice per experimental group. All behavioral tests were performed on 8–10-week-old mice. Only male mice were used throughout this study.
Gut permeability assay
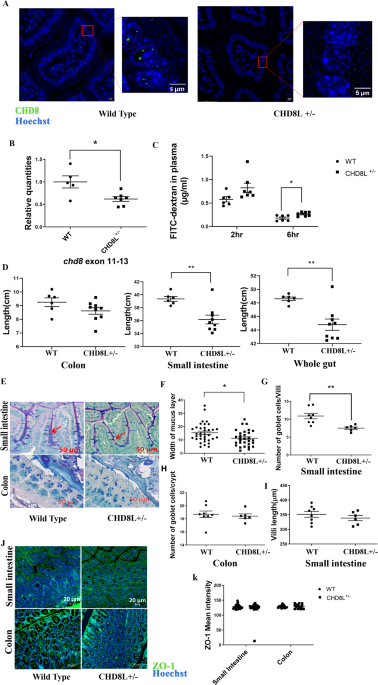
Fasting (6 h) 8-week-old mice were gavaged with 14 mL/kg body weight phosphate-buffered saline (PBS, pH 7.4) containing 22 mg/mL FITC-dextran (molecular mass 4.4 kDa; Sigma, St. Louis, MO, USA). A blood sample (150 µl) was collected by orbital retro bulbar puncture 2 h and 6 h after gavage. The blood samples were centrifuged (1000 X g at 4 °C), for 15 min, and the plasma supernatant (50 µl) was mixed with an equal volume of PBS (pH 7.4) and placed in the well of a 96-well microplate (black). The concentration of FITC-dextran was determined by spectrophotometry, at an excitation wavelength of 485 nm (20 nm band width) and an emission wavelength of 530 nm (25 nm band width).
Histology preparation
The small intestine and colon were excised from 8-week-old mice, immediately submerged in Ethanol-Carnoy’s Fixative at 4 °C for 2 h, and then placed in 100% ethanol, and then in 50%, 75% and 100% xylene, before being embedded in paraffin. Sections (5 µm) were cut from the paraffin blocks.
Alcian-blue periodic acid Schiff reagent (Ab/PAS) staining
Sections were deparaffinised and stained with alcian blue (Sigma, St. Louis, MO, USA; A5268) for 15 min. After washing with distilled water, they were treated with periodic acid (Sigma, St. Louis, MO, USA; p7875) for 5 min, washed in distilled water for 3 min, and then stained with Schiff reagent (Sigma St. Louis, MO, USA; 3952016) for 10 min. After rinsing sections under running tap water for 5 min, the nuclei were stained with haematoxylin for 1 min. Sections were then dipped into acid alcohol, dehydrated and mounted. Goblet cell counts and mucus layer thicknesswere determined using the ZEN Desk software.
After deparaffinisation, antigen was retrieved by incubating sections in sodium citrate buffer (pH = 6) for 20 min, at 60 °C. After cooling, sections were permeabilized with 0.1% Triton X-100, for 10 min and then blocked for 3 h, at room temperature, with 2% BSA (Calbiochem, San Diego, CA, USA; 126575) and 1% goat serum in 0.1% Tris buffer saline and triton-X (TbTx). The tissue sections were then immunofluorescently stained for 1 h, at room temperature and then overnight at 4 °C, with the following anitbodies: anti-CHD8 (1:100) (Abcam, Cambridge, UK; ab84527), anti-ZO-1 (1:200) (Thermo Fisher Scientific; 40–2200) and anti-DCLK1 (1:200) (Abcam, Cambridge, UK; ab31704). The sections were then washed three times with cold TbTx, for 10 min each, and incubated with Alexa 488-labeled anti-rabbit secondary antibody (1:200) (Jackson Immune Research Laboratories, West Grove, PA; 111–545–144) at room temperature for 2 h. After washing three times, for 10 min each, with TbTx, sections were stained with Hoechst (Sigma, St. Louis, MO, USA) (1:1000) and then mounted. The sections were examined with a fluorescence microscope.
Stool collection, DNA extraction and sequencing of 16 s rRNA gene
Mouse fecal samples were collected directly from the small intestine and colon and stored at −80 °C until analyses. DNA was isolated using the PureLinkTM Microbiome DNA Purification Kit, according to the manufacturer’s instructions. The V4 region of the bacterial 16 S rRNA gene was PCR-amplified using the 515 F and 806 R primers [http://www.earthmicrobiome.org/]. Forward primers included unique 12-base barcodes in order to tag PCR products. The PCR reaction included PrimeSTAR Max Premix 1x (Takara Bio, Shiga, JP), 0.4 μM of each primer and 30–100 ng DNA template. Reaction conditions were as follows: initial denaturing for 3 min at 95 °C, followed by 30 cycles of 10 s at 95 °C, 5 s at 55 °C and 5 s at 72 °C. PCR reactions were performed in duplicates for each sample, pooled and purified using the Agencourt AMPure XP kit (Beckman Coulter, Brea, CA, USA). Purified PCR products were quantified using a Qubit dsDNA HS assay kit (Life Technologies, Carlesbad, CA, USA) and 50 ng of each sample was pooled for further sequencing on the Illumina MiSeq platform.
Bioinformatic analyses of 16 S rRNA gene sequences
16 s rRNA sequencing data were analyzed by the QIIME 1 pipeline [43]. Alpha diversity (within-community diversity) was estimated by the Gini coefficient, a measure of community evenness. Beta diversity (between-community diversity) was calculated using weighted UniFrac distances. The diversity parameters were compared between groups using a nonparametric t-test with Monte Carlo permutations (999) to calculate p values. The Benjamini and Hochberg FDR method was then used to correct p values for multiple comparisons between different pairs of groups. Linear discriminant analysis (LDA) effect size (LefSe) was determined to identify differences in relative abundance at different taxonomic levels. Values used in analysis were alpha = 0.05 and LDA threshold of 2.0.
Gut epithelial cell isolation
Epithelial cells were collected from 5 wild type and 7 Chd8L+/− mice. All mice were 8-week-old male littermates. Epithelial cells were isolated as previously described by Zeineldin et al. [44]. Intestinal sections were washed with PBS, and then treated with 0.04% sodium hypochloride for 15 min, on ice. Specimens were then incubated in solution B (2.7 mM KCl, 150 mM NaCl, 1.2 mM KH2PO4, 680 mM Na2HPO4, 1.5 mM EDTA, 0.5 mM DTT) for 15 min, on ice. The specimens were then transferred to PBS and vortexed for 50 s. After repeating tincubation and vortex cycles three times, the solution was centrifuged at 1000 g, 10 min, 4 °C. Epithelial cells were concentrated in the pellet. The collected pellet were resuspended in buffer RLT for RNA purification using the RNeasy Micro kit (Qiagen, Hilden, DE; 74004), following the standard protocol with on-column DNase digestion.
RNA extraction from brain regions
Mice were sacrificed by rapid decapitation and brains were quickly removed. Sections (2 mm) of the frontal cortex and amygdala were isolated using a 13 G needle, and immediately frozen on dry ice. Total RNA was extracted using the RNeasy Mini Kit (Qiagen, Hilden, DE), according to the manufacturer’s protocol.
RNA sequencing and analysis
Sequencing libraries were prepared using the NEBNext Poly(A) mRNA Magnetic Isolation Module & NEBNext® Ultra™ II RNA Library Prep Kit for Illumina® sequencing. The 75-base-pair single-end sequencing was performed on the Nextseq 75SR. Reads were mapped to the Mus musculus reference genome (mm10) using the Tophat2 software (release Tophat2.0.12). Genes differentially expressed in gut epithelial cells are listed in Supplementary table 1 and mapped reads can be found in Supplementary Table 2. Differentially expressed genes and mapped read files for frontal cortex and amygdala RNA-seq is found in supplementary table 6. Differential gene expression analysis was performed using the DESeq2 pipeline. Enrichment analyses for the Gene Ontology (GO) terms were performed using the online ToppGene Suite software. GO terms were considered significant when the Benjamini and Hochberg FDR adjusted p value was below 0.05. The raw data and read count data from this analysis are available at GSE182815. GSEA was performed on genes from the RNA-seq analysis that were ranked by fold-change in expression between the two experimental groups. GSEA was performed as described previously [45], using GSEA v.2.0.1 (http://www.broadinstitute.org/gsea).
Real-time PCR
RNA was converted to cDNA using the Maxima H minus first strand cDNA synthesis kit with dsDNAse (Thermo Scientific, Waltham, MA, USA). Real-time PCR for tuft cell markers, antimicrobial peptide genes, CHD8 exon 1, exon 11–13 and exon 3 was performed using the Fast Start Universal SYBR Green Master (Roche, Basel CH) and ViiA™7 Real-Time PCR System (Life Technologies, Carlesbad, CA, USA). The PCR program was run for 40 cycles, and included a melting temperature of 95 °C for 10 s, and an annealing temperature of 60 °C for 30 s. Relative quantification of tuft cell abundance in the gut was performed using the ΔΔCt method. The primers used in the reactions are listed in Supplementary Table 4.
Bacterial load quantification
Bacterial load was quantified as described previously by Nadkarni et al. [46], using Taqman and the ViiA™7 Real-Time PCR System (Life Technologies, Carlesbad, CA, USA). The PCR thermocycler settings were as follows: 40 cycles of 95 °C for 20 s and 60 °C for 20 s. The ΔΔCt method was used to quantify relative bacterial abundance. Primers and probes used in these analyses are listed in Supplementary Table 4.
Antibiotic Treatment
Chd8L+/− mice and their WT controls (5 weeks old) were administered a combination of ciprofloxacin (0.04 g/L), metronidazole (0.2 g/L) and vancomycin (0.1 g/L) via their drinking water, for 3 weeks. All antibiotics were purchased from Sigma (St. Louis, MO, USA).
Behavioral testing
Mice were habituated to the room for at least 1 h before commencement of each test. Each test was performed on a separate day, usually with a 1-day interval between each test. Animal movement was filmed with a camera, and animal behaviour was tracked and automatically scored by the Noldus Software “ethovision”. All tested animals were included in the analysis unless they left the experimental arena. When necessary (e.g., antibiotics vs. no antibiotics), animals of the same genotype were randomly assigned to different experimental groups.
Open-field test
The mouse is placed in the corner of a plastic square box (50 × 50 cm) where it is allowed to move freely for 10 min, under ~120LUX of light. During this time, a camera films and tracks the behavior of the animal, including distance traveled.
Light/dark box test
The mouse is placed in a dark plastic chamber (75 × 75 cm) with an opening to a highly lit chamber (~1200 lux). The mouse is allowed to freely move between the two chambers for 5 min. During this time, a camera films and tracks the behavior of the animal, including its exact location inside the box, velocity, and distance travelled.
Elevated plus maze
The mouse is placed in the center of a four arms maze. Each arm is 30 cm in length, and two are closed and two are open. The maze is approximately one meter high. The mouse is free to choose which arm it enters for a 5 min period. During this time, a camera films and tracks the behavior of the animals, including where they are found in the maze, velocity, and distance travelled.
Social interaction test
The test is performed in a non-glare Perspex box (60 × 40 cm) with two partitions that divide the box into three chambers, left, center and right (20 × 40 cm each). The mouse is placed in the middle chamber for habituation (5 min) while the entry to both side chambers is barred. The test mouse was then allowed to explore the entire arena (10 min), and to freely choose between interacting with a novel mouse in one chamber or remaining in an empty chamber (social test). During this time, a camera films and tracks the behavior of the animals, and time spent in each chamber is measured. To assess mouse sniffing, the interaction between the nose of test mouse and the nose or body of a stranger mouse was analyzed. Interaction within an area of 2 mm was defined as positive sniffing interaction.
Marble-burying test
Repetitive marble burying was measured in a non-glare Perspex (20 × 40 cm) chamber. Twenty green glass marbles (15 mm diameter) were arranged in a 4 × 5 grid that covered 2/3 of the apparatus on top of 5 cm clean bedding. Each mouse was placed in the corner that did not contain the marbles and was given 30 min to explore the chamber, after which the number of marbles buried, was counted. “Buried” was defined as 2/3 covered by bedding. Testing was performed under dim light (25 lux).
Self-grooming
Each mouse is placed individually into an open-field chamber. After a 10 min habituation period, each mouse is scored using parameters of cumulative time spent grooming during a 20 min session.
A two-tailed unpaired T-test or two way ANOVA was performed using Graphpad prism 9.3 software. Data are presented as mean ± standard error of the mean (SEM). Supplementary Table 5 summarizes the results of all statistical tests mentioned in this manuscript.
This content was originally published here.