Mbd2 is required for cognitive, social, and emotional behaviors
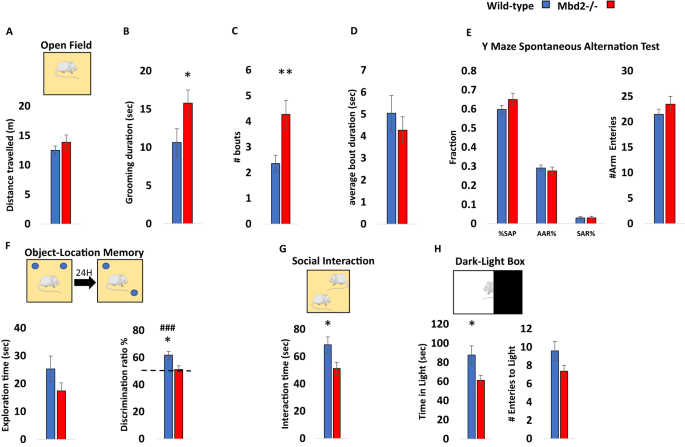
Previous studies on Mbd2−/− mice behavior found impaired maternal behaviors such as suboptimal feeding and delayed pup retrieval [23]. Hypoactivity, impaired nest-building behavior and mild spatial learning and memory impairments were found in male Mbd2−/− mice [30]. We further tested whether Mbd2 is involved in behavior using additional behavioral tests. We tested both male and female mice and found no significant effect of sex for any of the behaviors measured (two-way ANOVAs, p > 0.05 for main effect of sex and for interactions in all cases, Figs. S1–S3, with the exception of a significant main effect for sex on grooming bout length (Fig. S2C)). We therefore, grouped both males and females for subsequent experiments. There was no change in general locomotion and exploration in an open-field box (Fig. 1A, Fig. S4) However, we observed a significantly increased self-grooming time and number of grooming bouts in Mbd2−/− mice (Fig. 1B–D). Several forms of memory were tested as well. Short-term working memory was assessed by spontaneous alternations in Y-Maze and was found to be intact in Mbd2−/− mice. Also, the number of arm entries did not differ between groups suggesting normal exploration behavior in Mbd2−/− mice (Fig. 1E). In contrast, Mbd2−/− mice showed impaired memory-retention in the long-term object-location memory test and failed to explore the object in the novel location beyond chance levels (Fig. 1F). A previous study [30] did not find significant deficits in social behavior in Mbd2−/− mice using a three-chamber test which is a common test for sociability in mice. However, some mouse models for neurodevelopmental disorders show normal or near-normal behavior in the three-chamber test while showing reduced sociability in the social-interaction test [31,32,33]. These data suggest that the social-interaction test is either more sensitive and/or measures different aspects of sociability than the three-chamber test as it allows direct physical interaction and exploration between the mice in the arena. We therefore used the social-interaction test and found that Mbd2−/− mice exhibited reduced social-interaction time (Fig. 1G). We also measured anxiety-like behavior in the dark-light box and found that Mbd2−/− mice spent less time in the light compartment which indicates higher anxiety levels (Fig. 1H). Our findings support the hypothesis that Mbd2 is involved in regulating cognitive, social and emotional behaviors.

A Locomotion in the Open-field box was assessed for 5 min. n = 14 wild-type, n = 15 mMbd2−/−. B Self-grooming during open field. (Two-way ANOVA, main effect of genotype F(1,28) = 5.2, p = 0.0304). C Number of self-grooming bouts. (Two-way ANOVA, main effect of genotype F(1,28) = 9.62, p = 0.0044). D Average self-grooming bout duration. E Y-maze spontaneous alteration was not affected in Mbd2−/− mice (right). SAP-Spontaneous Alteration Performance, AAR-Alternate Arm Return, SAR-Same Arm Return. Exploration is expressed as number of arm entries (right). n = 17 wild-type, n = 17 Mbd2−/−. F Exploration time during object-location memory training (left) and discrimination ratio in object-location memory test (right). Discrimination ratio was significantly lower in Mbd2−/− mice (Two-way ANOVA, main effect of genotype F(1,24) = 5.05, p = 0.0341; n = 13 wild-type, n = 15 Mbd2−/−). G Social interaction. Mice were introduced to a novel mouse for 5 min and interaction time was recorded. (Two-way ANOVA, main effect of genotype F(1,29) = 5.02, p = 0.0329; n = 17 wild-type, n = 16 Mbd2−/−). H Time spent in the light compartment of the Dark-Light Box (left) (Two-way ANOVA, main effect of genotype F(1,29) = 5.3, p = 0.0287; n = 17 wild-type, n = 16 Mbd2−/−) and number of entries to the light side (right). Data are presented as mean ±SEM *p < 0.05, **p < 0.01 for wild-type vs Mbd2−/−. ### p < 0.005 for wild-type over chance (50%) exploration (one-sample t-test). Since no main effect for sex was observed in any of the tests (for full data see Figs. S1–S3) behavioral data from males and females were collapsed within genotype for clarity.
A Locomotion in the Open-field box was assessed for 5 min. n = 14 wild-type, n = 15 mMbd2−/−. B Self-grooming during open field. (Two-way ANOVA, main effect of genotype F(1,28) = 5.2, p = 0.0304). C Number of self-grooming bouts. (Two-way ANOVA, main effect of genotype F(1,28) = 9.62, p = 0.0044). D Average self-grooming bout duration. E Y-maze spontaneous alteration was not affected in Mbd2−/− mice (right). SAP-Spontaneous Alteration Performance, AAR-Alternate Arm Return, SAR-Same Arm Return. Exploration is expressed as number of arm entries (right). n = 17 wild-type, n = 17 Mbd2−/−. F Exploration time during object-location memory training (left) and discrimination ratio in object-location memory test (right). Discrimination ratio was significantly lower in Mbd2−/− mice (Two-way ANOVA, main effect of genotype F(1,24) = 5.05, p = 0.0341; n = 13 wild-type, n = 15 Mbd2−/−). G Social interaction. Mice were introduced to a novel mouse for 5 min and interaction time was recorded. (Two-way ANOVA, main effect of genotype F(1,29) = 5.02, p = 0.0329; n = 17 wild-type, n = 16 Mbd2−/−). H Time spent in the light compartment of the Dark-Light Box (left) (Two-way ANOVA, main effect of genotype F(1,29) = 5.3, p = 0.0287; n = 17 wild-type, n = 16 Mbd2−/−) and number of entries to the light side (right). Data are presented as mean ±SEM *p < 0.05, **p < 0.01 for wild-type vs Mbd2−/−. ### p < 0.005 for wild-type over chance (50%) exploration (one-sample t-test). Since no main effect for sex was observed in any of the tests (for full data see Figs. S1–S3) behavioral data from males and females were collapsed within genotype for clarity.
Landscape of Mbd2 binding in the hippocampus
We focused our analysis on the hippocampus since the behaviors affected in our study are known to involve hippocampal functions [34,35,36,37,38]. Additionally, other members of the MBD protein family were shown to have an important role in hippocampal function [12, 18, 39, 40]. We performed Mbd2 ChIP-sequencing on wild-type and Mbd2−/− animals to identify Mbd2 binding sites. We identified 2782 Mbd2 peaks annotated to 461 genes (FDR < 0.05, Fig. S5 for examples of MBD2 occupancy across relevant genomic regions). As expected, Mbd2 binds mostly to CpG-containing and GC-rich DNA regions (Χ2 = 123.49; df=1, p = 2.2E-16 and Χ2 = − 7168.2; df=1, p = 2.2E-16, respectively). De-novo motif discovery found the transcription-factors E2F8 and NFAT5 to be highly enriched in Mbd2 binding-peaks (Fig. S6A). NFAT family members were also enriched in known motif-enrichment analysis (Fig. S6B). The E2F and NFAT families have been reported to have a role in neurogenesis, and brain development [41,42,43,44]. We also compared our data to publicly available ChIP-Seq data of the mouse hippocampus histone-marks [45]. As expected, Mbd2 bound overall to regions that bind more repressive histone-marks (mostly H3K9me3) than to regions that bind active histone-marks (Fig. 2A, B). However, a subset of the peaks was bound to regions that had both active and repressive histone-marks. This might imply that either Mbd2 binds sites that are bivalently marked in the same cell or that Mbd2 binds DNA regions that have different chromatin states in different hippocampal cell-populations (Fig. 2C, D). Mbd2 co-occupancy with histone-marks on promoters, 3’-UTRs, TTS and exons was enriched for active histone-marks and depleted from repressive histone-marks consistent with an activating role in these genomic features (Fig. 2D). Exons and intergenic regions showed mildly enriched Mbd2 co-occupancy with repressive histone-marks (Fig. 2D). Pathway-analysis by GO-enrichment revealed enrichment of Mbd2 binding at several neuronal- and brain-related pathways including synapse assembly and axon-guidance (Figs. 2E and S7). GO-analysis of Mbd2 peaks associated with histone-marks found that Mbd2 peaks associated with active and bivalent histone marks are enriched for brain-related pathways including: axon guidance, axonogenesis and modulation of chemical synaptic transmission, thus further supporting a role for Mbd2 in neuronal development and function (Fig. 2F).

A Heatmap of the overlap between Mbd2 peaks and the following histone-marks in the hippocampus: H3K4me1, H3K4me3, H3k2me3, H3K27ac, H39Kme3, H3K36me3 and H4K20me1. B Analysis of the number of Mbd2 peaks located on histone-marks. C Co-occupancy enrichment analysis and D significance level of Mbd2 and histone-marks. E Pathway analysis enrichment of Mbd2 binding peaks (Top 5 pathways are presented). F Pathway analysis enrichment of Mbd2 binding peaks co-occupied with histone marks. G Q-ChIP validation of Mbd2 peaks. H Q-ChIP for RNApolII (SP5) and I H3K4me1. For Q-ChIP of Mbd2, RNApolII(SP5) and H3K4me1 pool of 5–6 mice analyzed by triplicate/group). Data are presented as mean ±SEM # p < 0.1, *p < 0.05, **p < 0.01 (T-test). Dashed lines represent Mbd2−/− binding levels. TTS Transcription Termination Site. UTR untranslated region.
A Heatmap of the overlap between Mbd2 peaks and the following histone-marks in the hippocampus: H3K4me1, H3K4me3, H3k2me3, H3K27ac, H39Kme3, H3K36me3 and H4K20me1. B Analysis of the number of Mbd2 peaks located on histone-marks. C Co-occupancy enrichment analysis and D significance level of Mbd2 and histone-marks. E Pathway analysis enrichment of Mbd2 binding peaks (Top 5 pathways are presented). F Pathway analysis enrichment of Mbd2 binding peaks co-occupied with histone marks. G Q-ChIP validation of Mbd2 peaks. H Q-ChIP for RNApolII (SP5) and I H3K4me1. For Q-ChIP of Mbd2, RNApolII(SP5) and H3K4me1 pool of 5–6 mice analyzed by triplicate/group). Data are presented as mean ±SEM # p < 0.1, *p < 0.05, **p < 0.01 (T-test). Dashed lines represent Mbd2−/− binding levels. TTS Transcription Termination Site. UTR untranslated region.
We selected several peaks of Mbd2 that were associated with promoters or enhancers in neuronal-related genes for further validation and for determining the impact of Mbd2 binding loss on transcription initiation (Table S1). Quantitative-ChIP-PCR confirmed Mbd2-binding to these regions and loss of binding in Mbd2−/− mice (Fig. 2G). We then determined whether loss of Mbd2 binding in promoters or enhancers in Mbd2−/− mice affects transcription onset. Mbd2-deficiency resulted in reduced transcription onset since occupancy of RNA-polymerase phosphorylated on Serine5; (RNApolII(SP5)) the form found on promoters upon transcription-initiation [46, 47] was reduced in Mbd2−/− mice. This was associated with increased abundance of histone-mark (H3K4me1) marking enhancers in Mbd2−/− hippocampi (Fig. 2H, I). H3K4me1 modification marks active as well as inactive enhancers [48, 49]. H3K4me1 peaks that are flanking the TSS were shown to exhibit a peak-valley-peak pattern. The valley usually overlaps with transcription-initiation and RNApolII(SP5) peaks [50] reflecting a nucleosome-free zone and thus reduced histone presence and reduced signal for the histone-marks, which is prerequisite for transcription-initiation [51]. In transcriptionally inactive genes H3K4me1 peaks cover the entire TSS forming one continuous TSS-centered peaks that overlap with the RNApolII(SP5) peaks. The increase of H3K4me1 concurrently with reduction of RNApolII(PS5) binding at the same position in Mbd2−/− mice is consistent with inhibition of transcription-onset in response to Mbd2-deficiency. These data suggest that Mbd2 is involved in activation of transcription turn-on in these neuronal-specific promoters.
Mbd2 is required for expression of neuronal-genes
To further elucidate the role of Mbd2 in hippocampal gene-expression we delineated the transcriptomes of wild-type and mbd2−/− mice. We found 2907 differentially-expressed genes (FDR < 0.05), of which 1590 genes were upregulated, and 1317 genes were downregulated in Mbd2−/− mice (Figs. 3A and S8). GO-enrichment analysis found a robust down-regulation of neuronal-related pathways such as neuron-projection development, trans-synaptic signaling and behavior (Fig. 3B) which were highly organized in clusters based on clustering analysis of the GO-networks (Fig. S9A, B). In contrast, upregulated genes were enriched for homeostasis and metabolism-related pathways (Fig. 3C). GO-analysis revealed poor clustering of the upregulated genes in these pathways (Fig. S10A, B). Next, we analyzed the subsets of genes that were annotated to Mbd2 binding peaks and also showed a significant change in their transcription levels. We did a pathway enrichment analysis for genes that were both annotated to Mbd2 ChIP peaks and were significantly up- or down-regulated at their transcription levels. In line with our other findings, we found 16 genes with Mbd2 peaks and downregulated mRNA levels were enriched for the GO-terms: “Cognition” p = 7.94E-05 and “Regulation of growth” p = 0.012. We also found 20 genes with Mbd2 peaks and upregulated mRNA levels that were enriched for the GO-term: “Membrane trafficking” p = 0.01.

A Heatmap of all transcribed genes in Mbd2−/− and wild-type mice sorted by log2 fold-change. B Pathway analysis enrichment of downregulated genes (Top 5 pathways are presented). C Pathway analysis enrichment of upregulated genes (Top 5 pathways are presented). D A cumulative distribution of methylation levels of regulatory DNA regions bound by Mbd2 demonstrating hyper-methylation in Mbd2−/− hippocampus (K-S test). E Number of differentially methylated CpGs (with at least 10% change in methylation and p < 0.001) in Mbd2-bound annotated genes showing that more CpGs became hyper-methylated then hypo-methylated (p = 0.00339, binomial test). F Number of differentially methylated CpGs (with at least 10% change in methylation and p < 0.001) located within Mbd2-peaks (p < 1E-8, binomial test). G Pearson correlation between differential promoter DNA-methylation and gene-expression in Mbd2−/− hippocampi.
A Heatmap of all transcribed genes in Mbd2−/− and wild-type mice sorted by log2 fold-change. B Pathway analysis enrichment of downregulated genes (Top 5 pathways are presented). C Pathway analysis enrichment of upregulated genes (Top 5 pathways are presented). D A cumulative distribution of methylation levels of regulatory DNA regions bound by Mbd2 demonstrating hyper-methylation in Mbd2−/− hippocampus (K-S test). E Number of differentially methylated CpGs (with at least 10% change in methylation and p < 0.001) in Mbd2-bound annotated genes showing that more CpGs became hyper-methylated then hypo-methylated (p = 0.00339, binomial test). F Number of differentially methylated CpGs (with at least 10% change in methylation and p < 0.001) located within Mbd2-peaks (p < 1E-8, binomial test). G Pearson correlation between differential promoter DNA-methylation and gene-expression in Mbd2−/− hippocampi.
The impact of Mbd2 depletion on the DNA methylation landscape
MBD proteins are “readers” of DNA methylation and bind specifically to methylated DNA [3, 52]. However, it is possible that they also play a role in maintaining DNA methylation/demethylation landscapes as has been previously proposed. Previous studies in T-regulatory cells using Mbd2−/− mice have suggested that Mbd2 depletion causes hypermethylation of regulatory regions which in turn results in downregulation of gene expression [53]. Therefore, we tested whether Mbd2-deficiency would alter the hippocampal DNA methylation landscape. We mapped with targeted-bisulfite-sequencing the methylation state of regulatory DNA regions (promoters and enhancers, see methods) in the hippocampi of Mbd2−/− and wild-type mice at a single-base resolution. An analysis of methylation level distribution across all sequenced CpGs revealed that Mbd2 binding regions defined in wild-type mice by ChIP-seq were hypermethylated in Mbd2−/− mice (Fig. 3D). Hypermethylation in response to Mbd2 depletion was observed also in a genome-wide scale analysis which examined DNA outside Mbd2-bound regions (Fig. S12C). The fact that changes in DNA methylation occur in regions outside of Mbd2 peaks suggests that Mbd2-deficiency could affect DNA methylation indirectly. We, therefore, examined our RNA-seq data for expression levels of methylated-CpG readers and modifiers. We found a significantly reduced expression of Tet2, Dnmt3a, Mbd1 and Mecp2 in Mbd2−/− mice (Fig. S11). The reduced expression levels of enzymes that promote de-novo DNA methylation (Dnmt3a) and de-methylation (Tet2), together with the reduced levels of methyl-CpG binding proteins (Mbd1 and Mecp2) possibly contributed to changes observed in the landscape of DNA methylation in Mbd2−/− mice. Taken together these data suggest that loss of Mbd2 affects DNA methylation in both directions. An analysis of the sequence properties of Mbd2-dependent DNA methylation suggests that Mbd2-deficiency results in increased methylation of low to intermediate methylated CpGs (10–40% methylation, Fig. 3D) but highly methylated CpGs ( > 40% methylation, Fig. 3D) are unaffected as expected if Mbd2 prevents hypermethylation. Partially methylated genes represent a group of genes that are heterogeneously methylated and possibly heterogeneously expressed across hippocampal nuclei. Mbd2 might be regulating the state of methylation of these genes.
We also analyzed differential-methylation at single CpG resolution. At this resolution differential-methylation analysis (at least 10% difference, FDR < 0.05; Fig. S12A) revealed 323 differentially-methylated CpGs, with 133 hypo-methylated CpGs (annotated to 103 genes) and 190 hyper-methylated CpGs (annotated to 119 genes) (differential-methylation data (p < 0.001) is detailed at Table S2). This finding also supports a significant overall hypermethylation in Mbd2−/− mice hippocampus (p = 0.0018, binomial-test). For pathway-analysis, to obtain a larger number of terms for the pathway analysis, we applied a more lenient significance cut-off for our data (p < 0.001) resulting in 3005 differentially methylated CpGs (1519 hypo-methylated and 1486 hyper-methylated). Next, we focused the analysis on CpGs located on promoters ( ± 1000 bp from TSS). We found 494 hypo-methylated CpGs located in 460 gene promoters and 476 hyper-methylated CpGs located in 434 gene promoters (Fig. S12A). Pathway analysis for differentially methylated gene-promoters revealed adrenergic receptor signaling and sodium- and metal- ion transports as the top three hyper-methylated pathways (-log10p-values: 4.86, 4.16 and 3.42, respectively). In contrast, the top hypo-methylated pathways were not specifically related to neurons or brain functions, although neuronal ion-channel clustering and positive regulation of sodium ion-transport pathways were enriched (-log10p-values: 3.289 and 3.280, respectively) (Fig. S12E, F). Overall, this analysis suggests an enrichment of hyper-methylated genes related to neuronal gene pathways in Mbd2−/− mice hippocampi.
Next, we assessed how binding of Mbd2 affects DNA methylation at single CpG resolution in Mbd2-bound genes. We analyzed the changes in DNA methylation levels in knockdown animals for CpGs (with at least 10% change and p < 0.001) annotated to Mbd2-bound genes and found significantly more genes had hyper-methylated CpGs (Fig. 3E). When analyzing only the subset of these CpGs which were located directly at Mbd2 binding peaks we found in almost all cases ( ~ 90%) hyper-methylation of these CpGs (Fig. 3F). This is consistent with a role for Mbd2 binding in maintaining a hypomethylated state.
To assess the relation between promoter DNA methylation and gene expression, we determined the correlation between methylation and expression. We found a significant linear inverse correlation between promoter DNA methylation and gene expression (Fig. 3G), supporting a role for DNA methylation in gene repression in the hippocampus. Unexpectedly, a subset of differentially methylated CpGs in promoters showed positive correlation between expression and methylation. We explored this finding by analyzing DNA motifs around these CpGs. While CpGs with inverse correlation (n = 66) had no significantly enriched motifs; CpGs with positive correlation (n = 40) had 3 enriched motifs (p values = 0.015–0.025). These enriched motifs were highly similar to known motifs of the KLF and SP transcription-factor families with top similarities to: KLF12, KLF14, SP3, and SP8 (Fig. S12D). The KLF and SP transcription factors are known to prefer binding to methylated-DNA (KLF) or to be unaffected by DNA methylation (SP) [54]. This finding suggests that genes whose methylation status does not correlate inversely with their expression, are regulated by transcription-factors that are not inhibited by DNA methylation.
We also validated our DNA methylation analysis results by targeted sequencing of bisulfite-converted PCR amplicons of nine Mbd2-binding regions each of which annotated to a different gene (Table S5)). Methylation levels in these Mbd2-bound regions strongly correlated with the levels obtained in the genome-wide capture sequencing analysis (Fig. S13A, B). Loss of Mbd2 promoted bi-directional alterations in DNA methylation status with enhanced hyper-methylation in Mbd2 binding regions, as observed earlier for the genome-wide analysis (Fig. S13C, D). Overall, there was a significant hyper-methylation in Mbd2−/− samples (Fig. S13E) as was observed in the genome-wide capture-sequencing.
Differentially expressed genes in Mbd2−/− mice are homologs of differentially expressed genes in ASD individuals’ brains and ASD risk genes
MBD proteins other than Mbd2 including MeCP2, Mbd1, Mbd5 and Mbd6 were previously proposed to be involved in ASD [11, 12, 39, 40, 55] and the presentation of behavioral abnormalities in Mbd2−/− mice described above resembles some of the observed symptoms of ASD. Therefore, we sought to explore the potential relation between our gene-expression findings and those found in post-mortem brains from neurodevelopmental disorders patients. We compared our data to the recently released cortex transcriptomic data from the psychENCODE consortium [26] for ASD, schizophrenia and bipolar disorder.
We found a significant overlap between differentially regulated genes in Mbd2−/− mice and individuals with ASD (Fig. 4A). We also found a weak, though significant, overlap between downregulated (but not upregulated) genes in Mbd2−/− mice and downregulated gene in schizophrenia patients (Fig. 4A). We did not find any significant overlap with bipolar disorder differentially expressed genes (Fig. 4A). We also found a significant positive correlation of gene-expression fold-change levels between Mbd2−/− mice and ASD individuals but not between Mbd2−/− mice and schizophrenia or bipolar-disorder patients (Fig. 4B).

A Heatmap of log10(p-values) of differentially expressed gene overlap between Mbd2−/− mice and ASD, schizophrenia and bipolar disorder human brain. Numbers within the heatmap indicate -log10(p-values). B Pearson’s correlations of fold-changes in gene-expression levels between Mbd2−/− mice and ASD (n = 286 genes), schizophrenia (n = 686 genes) and bipolar disorder human brain (n = 137 genes). C An overlap analysis revealed a significant intersection between human ASD high risk genes and downregulated (Top) but not upregulated (Bottom) genes in Mbd2−/− hippocampi. D An overlap analysis revealed a significant intersection between human ASD risk genes based on the SFARI Gene Project and downregulated (Top) but not upregulated (Bottom) genes in Mbd2−/−. (Hypergeometric tests). E Western blot analysis showing reduced protein levels of Drd2, Pogz and Zbtb16 in Mbd2−/− mice hippocampi. Proteins molecular weights as determined using molecular weight markers are indicated. Note: circle sizes are not to scale.
A Heatmap of log10(p-values) of differentially expressed gene overlap between Mbd2−/− mice and ASD, schizophrenia and bipolar disorder human brain. Numbers within the heatmap indicate -log10(p-values). B Pearson’s correlations of fold-changes in gene-expression levels between Mbd2−/− mice and ASD (n = 286 genes), schizophrenia (n = 686 genes) and bipolar disorder human brain (n = 137 genes). C An overlap analysis revealed a significant intersection between human ASD high risk genes and downregulated (Top) but not upregulated (Bottom) genes in Mbd2−/− hippocampi. D An overlap analysis revealed a significant intersection between human ASD risk genes based on the SFARI Gene Project and downregulated (Top) but not upregulated (Bottom) genes in Mbd2−/−. (Hypergeometric tests). E Western blot analysis showing reduced protein levels of Drd2, Pogz and Zbtb16 in Mbd2−/− mice hippocampi. Proteins molecular weights as determined using molecular weight markers are indicated. Note: circle sizes are not to scale.
Next, we compared our gene-expression data with that of two human ASD risk-genes databases: a study by Sanders et al. [27]and the SFARI-gene database. We found a robust overlap between ASD-risk genes and downregulated genes in Mbd2−/− mice. Twenty-four ( ~ 37%) out of 65 ASD-risk genes found by Sanders et al. [27] were downregulated in Mbd2−/− mice (Fig. 4C and Table S3). In contrast, only 3 genes from the 65 gene list were upregulated in Mbd2−/− mice. The 24 commonly downregulated genes in Mbd2−/− mice and humans also formed a significant protein-protein interaction network (Fig. S14A) with some of the top GO pathway annotations related to “regulation of biological and cellular-processes” and “nervous-system development” (Table S4).
Next, we compared our RNA-seq results to the SFARI-gene list of ASD-associated genes which contains all known human genes associated with ASD. Here again, out of 951 human genes associated with ASD, 125 were downregulated (Fig. 4D and Table S3) while only 44 were upregulated in Mbd2−/− mice (Fig. 4D and Table S3). Analysis of Mbd2-regulated ASD-associated gene lists revealed significant protein–protein interactions enrichments. The 125 downregulated genes which appear also in the SFARI ASD-associated gene-database projected into a significantly enriched protein-protein network (Fig. S15A) with “nervous-system development” and ”behavior” as the most enriched GO-pathways within the network (Table S4). The 44 upregulated genes that appear also in the SFARI ASD-associated gene-database projected into a significantly enriched protein-protein network (Fig. S15B) with “dendritic spine morphogenesis” and “modulation of excitatory postsynaptic potential” as the most enriched GO-pathways within the network (Table S4).Taken together, these transcriptomic and genomic cross-species comparative analyses suggest that Mbd2 might serve as an upstream regulator to many ASD-associated genes. This is in line with previous observations that showed regulatory roles for Mbd2 in liver, breast and prostate cancer genes in cancer cell lines [56,57,58], NGFIA in hippocampal cells [17] and Foxp3 gene [53] in regulatory T-cells. We further analyzed the protein levels of few members of the protein-protein network of ASD-risk genes and found reduced protein levels of these genes in Mbd2−/− mice (Fig. 4E) which agrees with the mRNA reduction we observed before.
Morphological changes in the hippocampus were observed. We found increased neuron count in the CA2 region of the hippocampus, increased neuronal soma size in CA3 and reduced CA1 thickness (Fig. S16). We also found a negative correlation between neuron soma size and neuron count (for CA1 and when all regions’ data was collapsed, Fig. S17) and between neuron soma size and thickness (for CA2, Fig. S17). These changes indicate an increased neuronal density and reduced thickness in the hippocampus of Mbd2−/− mice, phenomena which were previously reported in ASD rodent models and human subjects [59,60,61]. Increased neuronal density was also observed in the cortex of children with autism [62].
Hippocampal Mbd2 down-regulation impaired cognitive and emotional behaviors
Next, we asked whether hippocampal Mbd2 is casually involved in regulation of behaviors that are impaired in adult Mbd2−/− mice. We therefore examined whether Mbd2 down-regulation in adult mice affects some or all of the behavioral changes seen in Mbd2−/− mice which lacked the gene both during embryogenesis and post-natal development. To this end, we constructed several shRNA lentiviruses which targeted Mbd2 mRNA (sh-Mbd2; Fig. S18A, B). The construct which was the most active in Mbd2 depletion as tested in-vitro was infused in-vivo into the hippocampus of adult wild-type mice to knockdown Mbd2 (Fig. 5A, B). GFP-expressing-cells were found near the injection site and up to the dentate gyrus and stratum radiatum of CA3 (Fig. S18D–H). Following the infusion and recovery we tested the mice in the same behavioral tests that were found to be abnormal in Mbd2−/− mice. Down-regulation of Mbd2 did not affect locomotion (Fig. 5C) but increased self-grooming time and average grooming bout duration (Fig. 5D–F). Mbd2 down-regulation resulted in failure of treated mice to remember location of objects in the object-location-memory test. While control mice explore the object in the novel-location significantly more than the familiar location (p < 0.05, one-sample t-test), sh-Mbd2-treated mice did not explore the object in the novel location any longer than chance level (Fig. 5G). Interaction time in the social-interaction test was not affected by Mbd2 down-regulation (Fig. 5H). In the Dark-Light-Box test, sh-Mbd2-treated mice showed increased anxiety expressed as reduced time in the light compartment (Fig. 5I, J). Taken together, these results show that hippocampal Mbd2 knockdown in adult mice recapitulate most of the behavioral abnormalities found in Mbd2−/− mice but not the social interaction deficiency.

A shMbd2 viral construct reduces Mbd2 mRNA. Mbd2 mRNA levels were reduced in the hippocampus from shMbd2-infused mice compared with scramble control-infused mice. Scramble n = 6, shMbd2 n = 4 (T test). B Representative micrograph of Mbd2 immunolabeling in hippocampal slices from Scramble- and shMbd2– infused mice. Scale bar: 200 μm. C Locomotion in Open-field box. D Self-grooming during open field. E Number of self-grooming bouts. F Average self-grooming bout duration. G Discrimination ratio in object-location memory test. H Social interaction test. I Time in the light compartment of the Dark-Light Box and J number of entries to the light side. Data are presented as mean ±SEM *p < 0.05, for wild-type vs Mbd2−/− (t-test). # p < 0.05 for wild-type over chance (50%) exploration (one-sample t-test). Scramble n = 7, shMbd2 n = 6.
A shMbd2 viral construct reduces Mbd2 mRNA. Mbd2 mRNA levels were reduced in the hippocampus from shMbd2-infused mice compared with scramble control-infused mice. Scramble n = 6, shMbd2 n = 4 (T test). B Representative micrograph of Mbd2 immunolabeling in hippocampal slices from Scramble- and shMbd2– infused mice. Scale bar: 200 μm. C Locomotion in Open-field box. D Self-grooming during open field. E Number of self-grooming bouts. F Average self-grooming bout duration. G Discrimination ratio in object-location memory test. H Social interaction test. I Time in the light compartment of the Dark-Light Box and J number of entries to the light side. Data are presented as mean ±SEM *p < 0.05, for wild-type vs Mbd2−/− (t-test). # p < 0.05 for wild-type over chance (50%) exploration (one-sample t-test). Scramble n = 7, shMbd2 n = 6.
This content was originally published here.